-
Star
(245)
You must be signed in to star a gist -
Fork
(23)
You must be signed in to fork a gist
| library(geojsonsf) | |
| library(sf) | |
| library(rayrender) | |
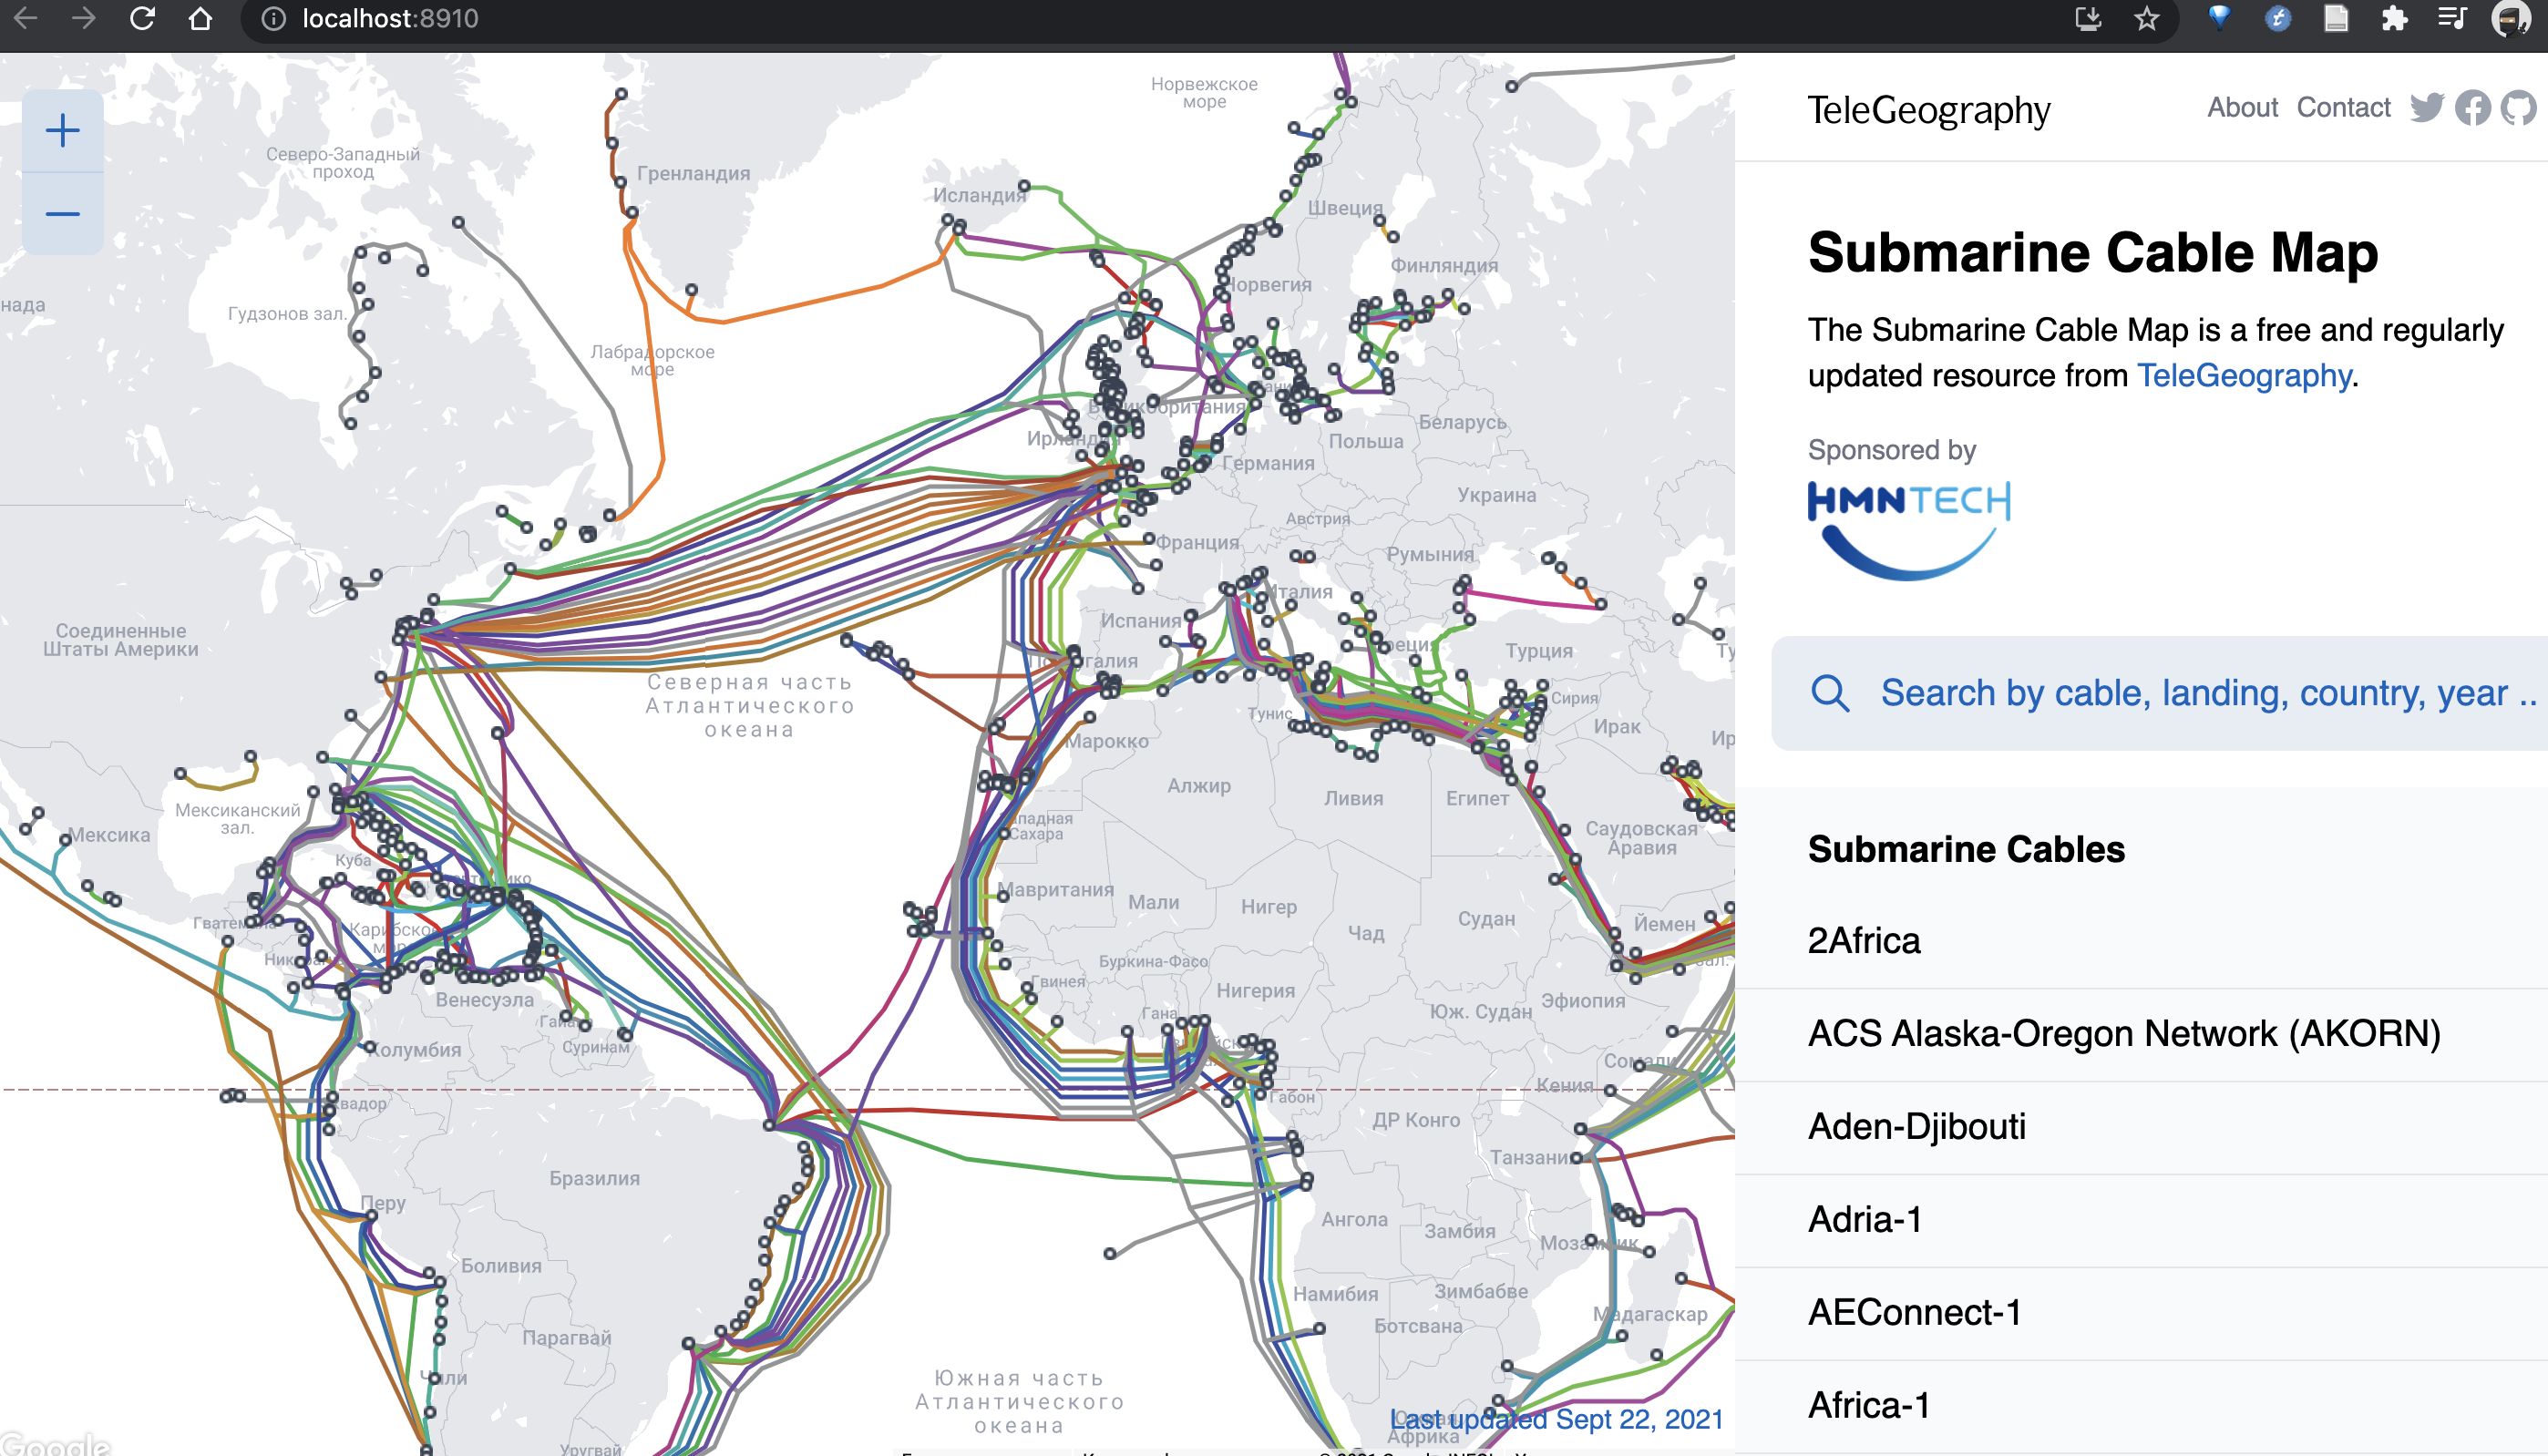
| #Data source: https://github.com/telegeography/www.submarinecablemap.com | |
| cables = geojson_sf("cable-geo.json") | |
| cablescene = list() | |
| counter = 1 | |
| for(i in 1:length(cables$geometry)) { | |
| for(j in 1:length(cables$geometry[[i]])) { | |
| temp = cables$geometry[[i]][[j]] | |
| cableval = data.frame(x=sinpi(temp[,1]/180)*cospi(temp[,2]/180), | |
| y=sinpi(temp[,2]/180), | |
| z=cospi(temp[,1]/180)*cospi(temp[,2]/180)) | |
| #Don't lower start of line at the 180/0 longitude border | |
| if(abs(temp[1,1] - 180) > 0.001 && abs(temp[1,1] + 180) > 0.001) { | |
| cableval[1,] = cableval[1,] * 1/1.02 | |
| } | |
| nr = nrow(temp) | |
| #Don't lower end of line at the 180/0 longitude border | |
| if(abs(temp[nr,1] - 180) > 0.001 && abs(temp[nr,1] + 180) > 0.001) { | |
| nr = nrow(cableval) | |
| cableval[nr,] = cableval[nr,] * 1/1.02 | |
| } | |
| cablescene[[counter]] = path(cableval, width = 0.005,material=diffuse(color=cables$color[i])) | |
| counter = counter + 1 | |
| } | |
| } | |
| fullcablescene = do.call(rbind,cablescene) | |
| for(i in seq(1,720,by=1)) { | |
| group_objects(fullcablescene,scale=c(1,1,1)*1.02) %>% | |
| add_object(sphere(radius=0.99,material=diffuse(image_texture = "2k_earth_daymap.jpg"),angle=c(0,-90,0))) %>% | |
| group_objects(angle=c(0,-i/2,0)) %>% | |
| add_object(sphere(y=5,z=5,x=5,material=light(intensity = 80,color="lightblue"))) %>% | |
| add_object(sphere(y=5,z=5,x=-5,material=light(intensity = 10,color="orange"))) %>% | |
| add_object(sphere(y=-10,material=light(intensity = 3,color="white"))) %>% | |
| render_scene(samples=64,width=1200,height=1200,fov=0,aperture=0, ortho_dimensions = c(2.3,2.3), | |
| sample_method = "sobol_blue",filename=sprintf("smallcables%d.png",i)) | |
| } |
YoViajo
commented
Sep 30, 2021
- Descarga los archivos a los que hace referencia el código R (1 archivo GeoJSON, 1 archivo JPG) usando los enlaces mencionados líneas arriba (en los comentarios)
- En el código R, ajusta la referencia de ruta de los archivos descargados (según tu definición)
- Ejecuta el código R en tu ambiente favorito (e.g, R-Studio). Prepárate para esperar. En mi caso tomó 40 horas en completar.
- La salida es grupo de imágenes PNG que visualizadas juntas pueden animarse como un video. Yo utilicé ffmpeg para hacer esa combinación.
The SFU link for the JPG doesn't work, here's the wikimedia source file.
https://upload.wikimedia.org/wikipedia/commons/c/c3/Solarsystemscope_texture_2k_earth_daymap.jpg
Hi,
I was wondering if anyone still had access to a repo of the Telegeography submarine cable map. They no longer maintain their public github as of 2 weeks ago, and I wanted to look at their source code. Thank you!
I was looking for it as well, I think you get it from the attachments here,
https://observablehq.com/@ariellemartinez/submarine-cable-map
Good Luck!
I have consolidated and modified a little there :
Some pointers for beginners to R:
- You'll need three R packages: "geojsonsf", "sf", and "rayrender"
- "sf" expects some libraries to be installed on your system, see its readme on how to do this, for example for Linux
- You'll need a Fortran compiler. If you're on Arch Linux:
pacman -S gcc-fortran - After installing R and opening its command line, install the packages with
install.packages(c("geojsonsf", "sf", "rayrender")) - Then run the script with
source("submarine_cable_map.R")
I'm offering the PNGs of the cable map via the following torrent magnet link since rendering them can take a few hours, depending on your hardware:
magnet:?xt=urn:btih:d3d832c365c5f7ec88d0bea1a4d3906a064950f9&dn=submarine_cables_map_pngs
Turn the PNGs into a video using, for example:
ffmpeg -i smallcables%03d.png -vf scale=720:720 -crf 55 globe.webmffmpeg -i smallcables%03d.png -vf scale=720:720 -pix_fmt yuv420p -crf 26 globe.mp4
Reduce the value of -crf for higher quality or set the resolution to something else, for example: scale=1024:1024
cables = geojson_sf("cable-geo.json")
"Error in rcpp_geojson_to_sf(geojson, expand_geometries) : Invalid JSON"I guess that you're supposed to do the installation of the cable map first as described here, but after doing so, how do I export this map into a .json file like you did ("cable-geo.json")?
EDIT: oh boy it was all simple I was supposed to just download & save a file linked here
Hey ! If available, can you please send me the dataset for the cables-map, unfortunately telegeography stopped maintaining their public github repo for downloads. Would really like to work on this dataset. If anyone can help, i would really appreciate the support !
The Internet Archive is your friend. https://web.archive.org/web/20220325102119/https://github.com/telegeography/www.submarinecablemap.com
https://www.submarinecablemap.com/api/v3/cable/cable-geo.json https://www.submarinecablemap.com/api/v3/landing-point/landing-point-geo.json https://www.submarinecablemap.com/api/v3/cable/all.json
Does anyone know if this API is maintained and up-to-date?
https://www.submarinecablemap.com/api/v3/cable/cable-geo.json https://www.submarinecablemap.com/api/v3/landing-point/landing-point-geo.json https://www.submarinecablemap.com/api/v3/cable/all.json
Does anyone know if this API is maintained and up-to-date?
These json files are used to plot https://www.submarinecablemap.com as can be seen from browser developer tools, so I'm assuming it should be up-to-date and consistent with the website?

