ConMon is a command line utility that measures the traffic to and from an endpoint. ConMon passively monitors the IP packets and classifies them to measure the bit rate for each of the classifiers.
It is based on the Sniffer example in libpcap (tcpdump).
- Total, TCP, UDP, local, external [done]
- Each is further classified as combined, inbound, outbound and background [done]
- IPv4 and IPv6
- Multimedia Transport: RTP (for RTCWEB, MPRTP, RTSP, etc.)
- Multimedia Signaling: STUN, ICE packets
- HTTP(S): port 80 and 443
- LEDBAT: e.g., Bittorrent
The project comes with a basic Makefile and depends on the following libraries:
ConMon has two threads:
- Main Thread: captures packets based on
filter expressionand store packets to "Packet Logs". - Event Thread: times out every
1sand stores the {num_pkts, bytes} per classifier to the "Time Logs".
Alternatively, to use autotools execute the following steps
$ ./autogen.sh
$ ./configure
$ make
ConMon requires root privileges to capture packets. Until ConMon
v0.2.1 the captured packets
are stored locally (in files at logs/) and therefore the "user" has full
control of their data. If we implement a backend service to capture the
logs, we will then add a method to obfuscate the user's IP addresses to
preserve their privacy. ConMon
currently creates two files
in logs/
- Packet Logs:
pkt_list_$filter_$interface.txt(e.g.: pkt_list_ip_en1.txt) - Time Logs:
time_list_$filter_$interface.txt(e.g.: time_list_ip_en1.txt)
- ConMon has two command line parameters: interface and filter.
$./conmon --help
Usage: conmon [interface] [filter]

Options:
    interface     Listen on <interface> for packets.
    filter        PCAP Filter to apply on packets.
- Running without any parameters sets default PCAP filter="ip" and shows a menu to choose interfaces. For example:
$ sudo ./conmon

1. en0  (No Desc.)
2. fw0	(No Desc.)
3. en1	(No Desc.)	IPv6: fe80::xx:xx:xx:xx%en1	IPv4: xx.xx.xx.xx
4. p2p0	(No Desc.)
Enter the interface number (1-4):
- If you do not want the choose the network interface every time then pass it as a command-line argument. You can use
ifconfigto lookup the interfaces.
For example:
$ sudo ./conmon en1
IP ADDR: xx.xx.xx.xx  MASK: 255.255.240.0	Device: en1	Filter expression: ip
- You may use an alternate PCAP filter. For example:
$ sudo ./conmon en1 tcp
IP ADDR: xx.xx.xx.xx  MASK: 255.255.240.0  Device: en1	Filter expression: tcp
In the plots/ folder there is a script (source plots.sh) to generate
the plots based on the "Time Logs" (e.g.: time_list_ip_en1.txt). We use
Gnuplot to generate the PDF
plots (See Pg. 174 for list
of terminal options).
plots.sh takes as command line argument the filename of the "time logs"
(without the file extension). For example:
$./plots.sh time_list_ip_en1
# will generate the following files
time_list_ip_en1_total.pdf
time_list_ip_en1_tcp.pdf
time_list_ip_en1_udp.pdf
time_list_ip_en1_local.pdf
time_list_ip_en1_external.pdf
Each graph is a
multiplot(http://gnuplot.sourceforge.net/demo_cvs/multiplt.html) that
shows the combined, incoming, outgoing and cross-traffic. An Example plot
of the UDP traffic is shown below:
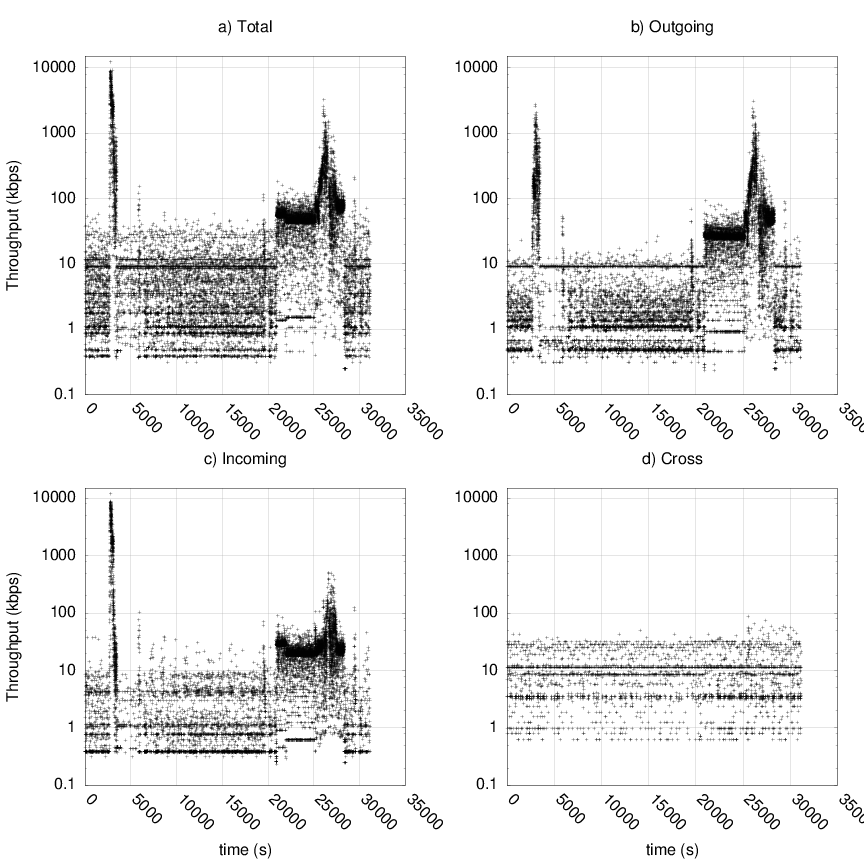
A bit about the graph:
The first spike (upto 10 Mbps) is caused by Bittorrent. I downloaded ~300MB torrent. The second cluster of spikes is caused by Skype. I initially started with an audio call and later upgraded to video, therefore, we observe larger spikes You may notice that it is a bit assymetric (compare the
incomingandoutgoingthroughput plots,the magnitude of the spikes are different) this is due to the rate-control algorithm at the the two ends.
u_int isRTP (const u_char *packet, ...) in conmon.cc detects RTP and
the RTP and RTCP headers are defined in rtp.h. Currently, ConMon is only
tested for RTP but should also work for RTCP. However, it should be noted
that the current implementation produces many false positives because ConMon
does not implement any RTP header validation mechanisms. Upon detection
each RTP packet is appended to the appropriate RTP logs file. The log
files are stored in the rtp/ folder and are of the form
rtp_*_$pt_$ssrc.txt
To generate graphs per RTP media stream execute the rtp_bitrate.sh
with the appropriate RTP log file as a command line parameter.
For example:
$ source rtp_bitrate.sh rtp_1345972446_96_aaaabbbb
- create above classifiers [done]
- create vectors/map of {num_pkts, bytes} for each of the above classifiers [done]
- create plots to show changes in bit rate for the above classifiers [done]
- If data is uploaded then hash the source/destination IP addresses. [not needed currently, as data is stored locally!]
- Test RTP, RTCP, RTCP-mux, A/V-mux, etc.
- Use some heuristics to reduce false-positives in RTP detection.
- create an API so that applications can query the bit rate for a specific classifier
- convert or allow ConMon to run as a daemon
- There may be bugs related to IPv6 in some places. ConMon is a fork from my earlier project Snapper
If you want to parse a packet look at got_packet() there is a switch case
that parses the protocol field. You can add your own code or function to
parse the associated packet (see ParseUDPPacket()/ParseTCPPacket() in
conmon.c).