This template is my ideal format for issues submitted to a github repository.
auremoser
/ phobias.tsv
Last active
April 20, 2022 15:02
— forked from miguelbermudez/phobias.tsv
Data-Phobias
This file contains bidirectional Unicode text that may be interpreted or compiled differently than what appears below. To review, open the file in an editor that reveals hidden Unicode characters.
Learn more about bidirectional Unicode characters
| phobiaName | phobiaDefinition | |
|---|---|---|
| Ablutophobia | Fear of washing or bathing. | |
| Acarophobia | Fear of itching or of the insects that cause itching. | |
| Acerophobia | Fear of sourness. | |
| Achluophobia | Fear of darkness. | |
| Acousticophobia | Fear of noise. | |
| Acrophobia | Fear of heights. | |
| Aerophobia | Fear of drafts, air swallowing, or airbourne noxious substances. | |
| Aeroacrophobia | Fear of open high places. | |
| Aeronausiphobia | Fear of vomiting secondary to airsickness. |
Aurelia Moser, Map Scientist, CartoDB Workshop - Yale February 4, 2015
Find this document here: http://bit.ly/1At1cQQ | Gist

- Introduction to CartoDB
###SVA-DSI ###Metrics and Data Visualiation I October 18th, 2016
Find this document here:
- Gist:
July 29, 2015
Find this document here:
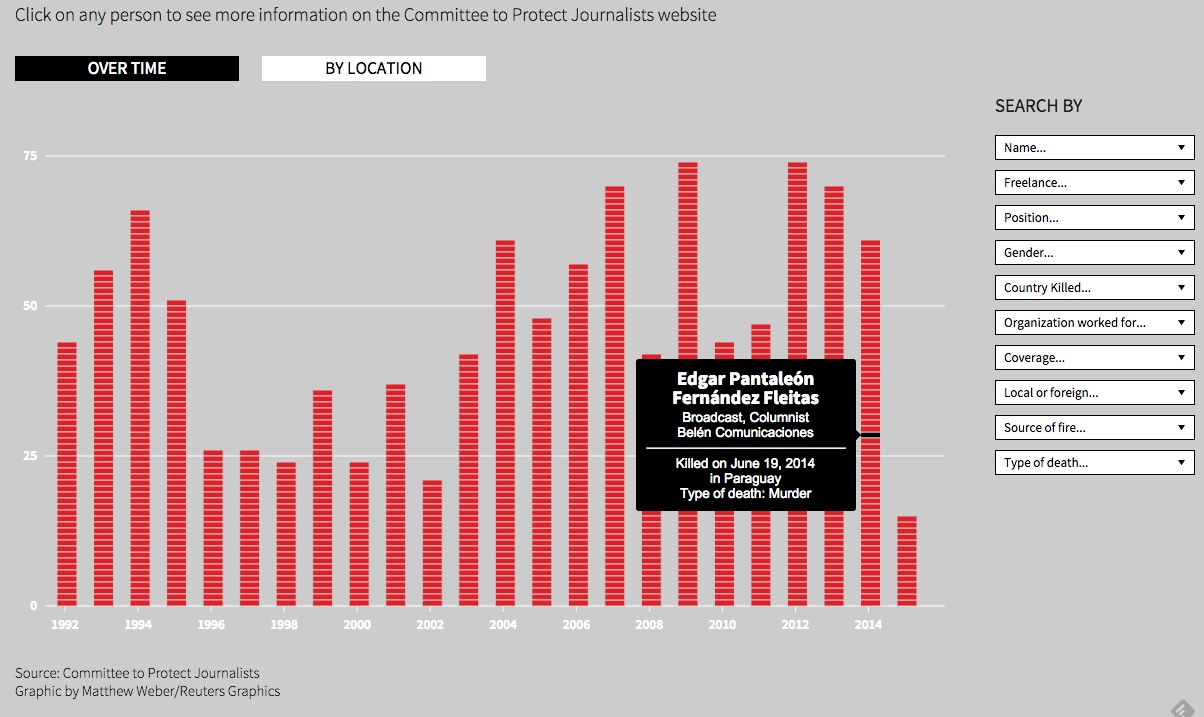
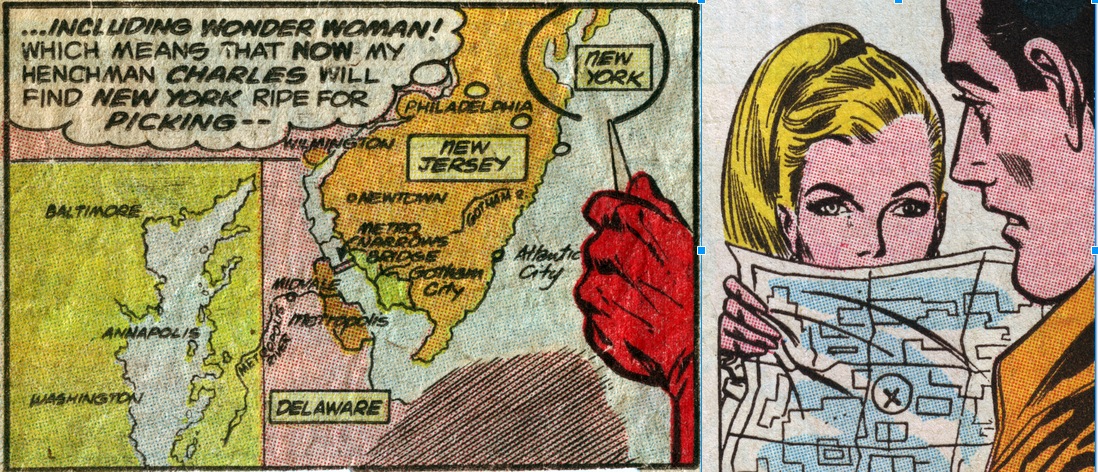
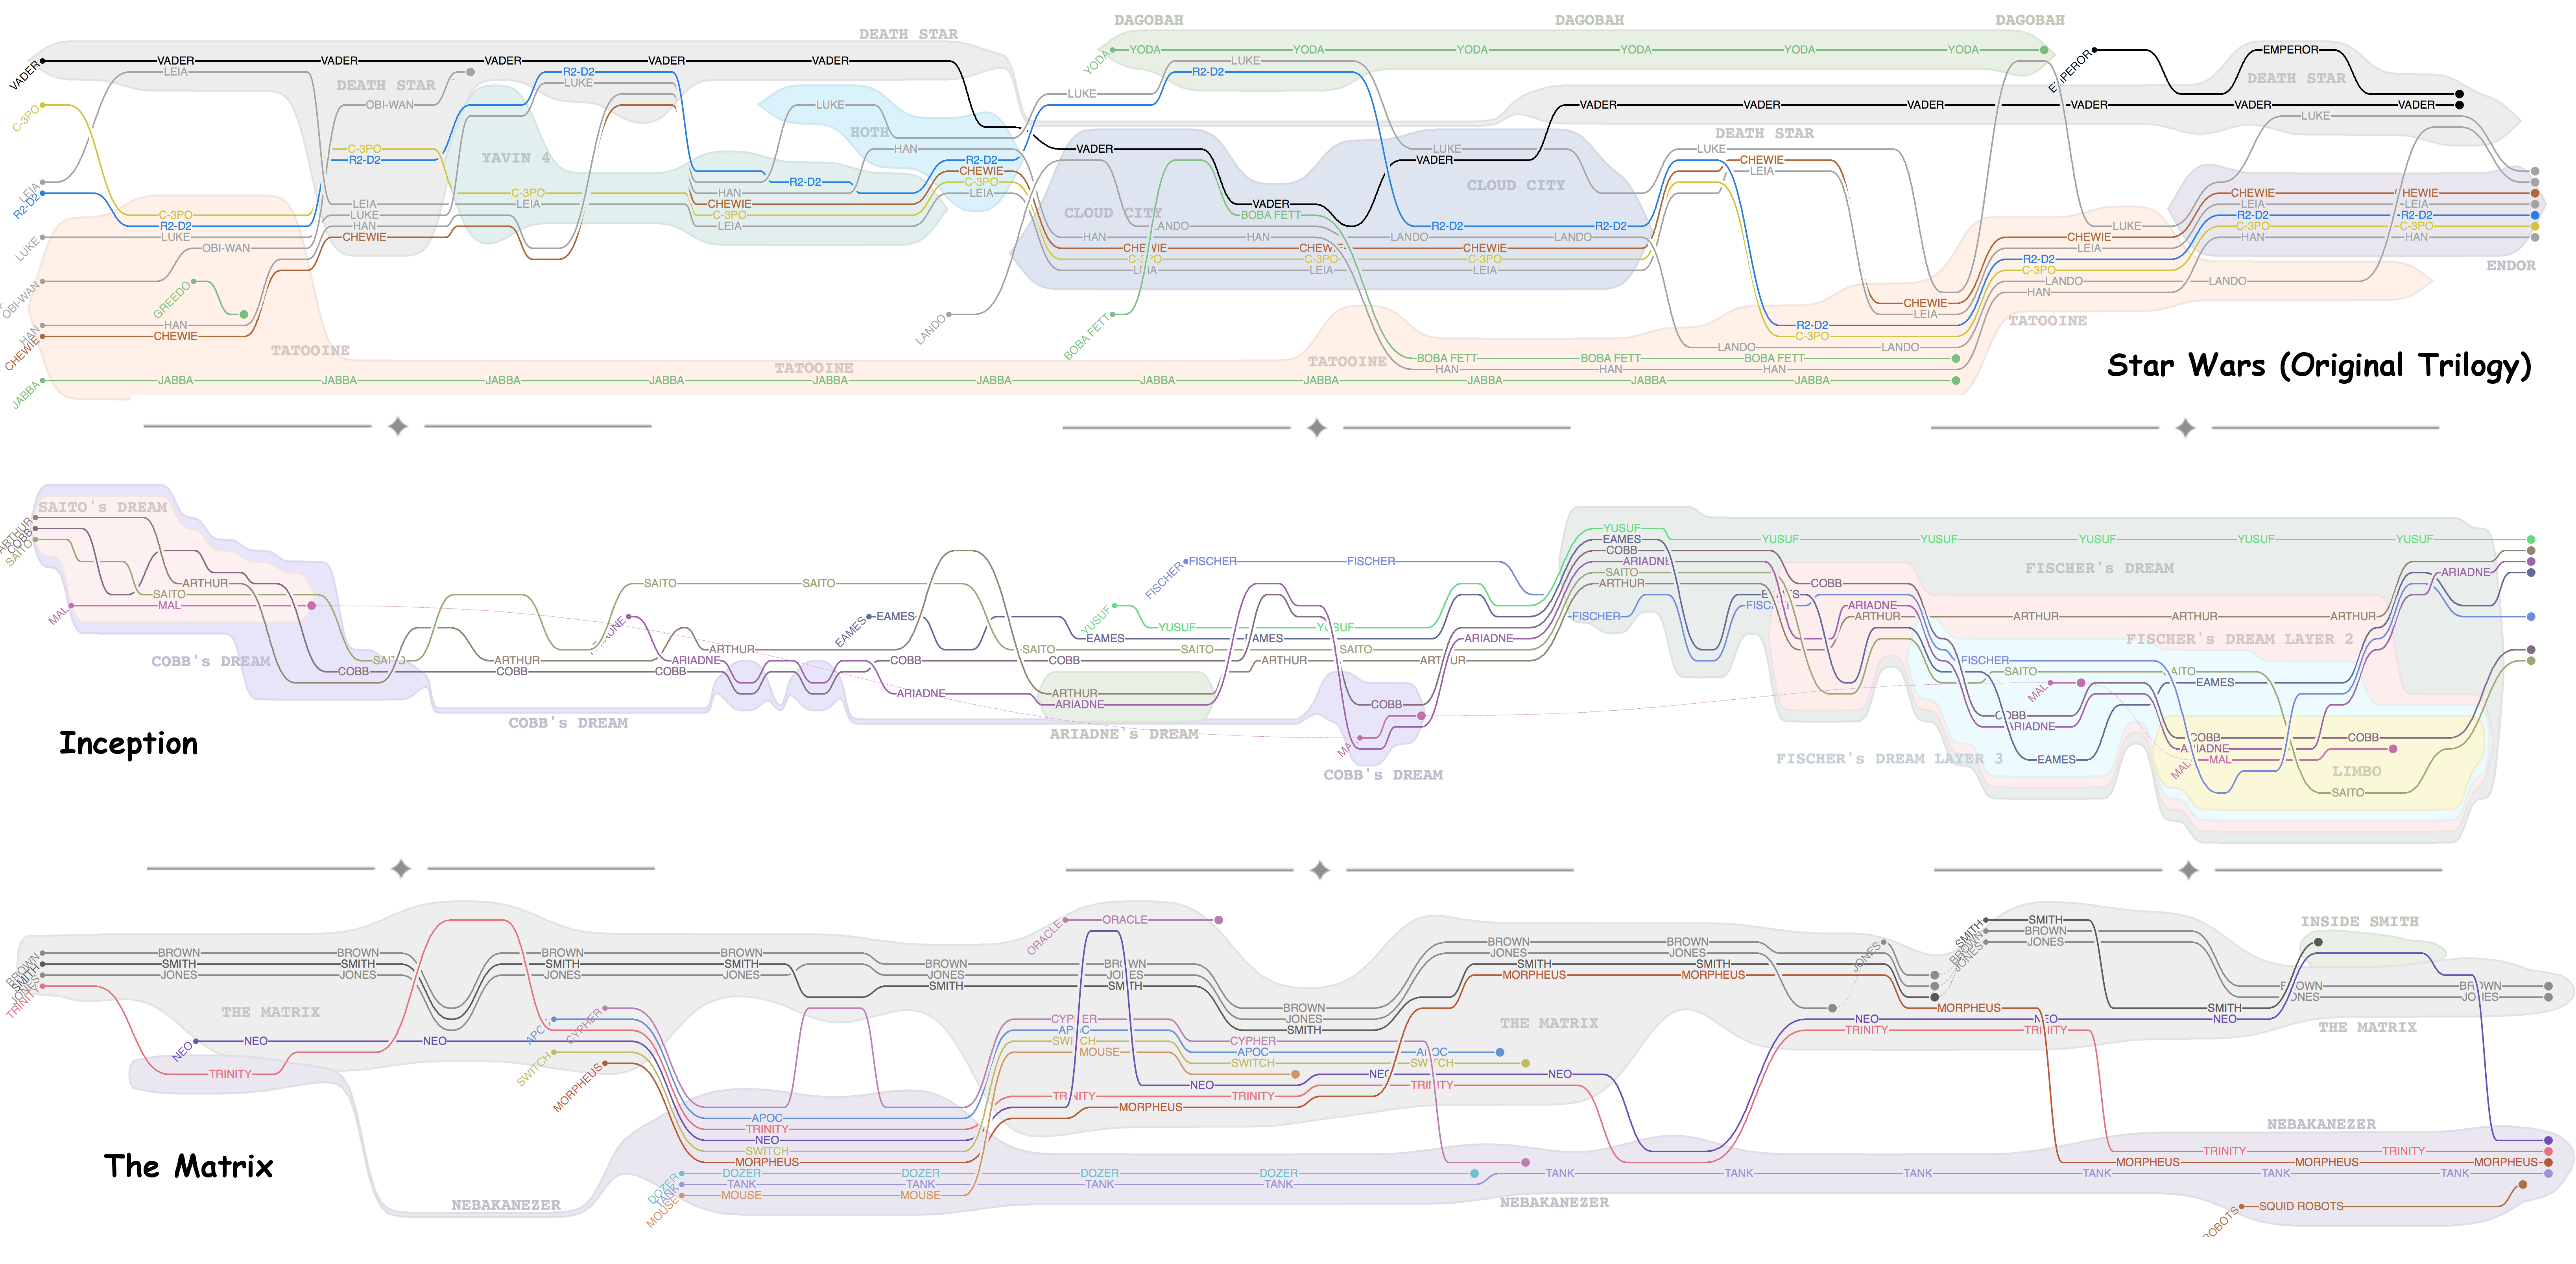
The meaning of "map" across disciplines is remarkably varied. It's effectively a spatial representation of geo-topography, a linking between tables by foreign key, a datatype in C++... At CartoDB, users make creative use of our custom basemaps feature, building remarkable maps of multivariate information off-the-(beaten) geographic projection. Many have designed and published interactive maps of cemetery burial plots, galactic drawings of the Star Wars Universe, heatmaps of court traffic during the NBA finals. Let's explore other maps, and investigate topic and themes not yet covered in interactives...talk about how to map them, and why mapping unmapped data might be the perfect expression of their meaning.
###Girl Develop It
Aurelia Moser, @auremoser, aurelia@cartodb.com
Andy Eschbacher, @MrEPhysics, eschbacher@cartodb.com
August 19th, 2015
Find this document here:
###SVA-DSI ###Metrics and Data Visualiation I October 25th, 2016
Interactive to inspire: Tanahashi, Y., UC Davis, StoryLines You can read their paper on the topic here.
###5/3/16 11:30 AM Berlin
####Intro
- Catalase activity in Smicridea McLachlan, 1871 (Insecta, Trichoptera) collected from natural and altered/impacted streams - Scientific Figure on ResearchGate. Available from: https://www.researchgate.net/281340883_fig1_Figure-1-Map-of-the-sampling-sites-CV-riparian-vegetation-and-CSV-agriculture-land
- Nailpolis, Ceci n'est pas une pipe!, http://www.nailpolis.com/artworks/nerdyfleurty-ceci-n-est-pas-une-pipe-5442
- NASA Earth Observatory (2015, February 12) Landsat Goes Over the Top: A Long View of the Arctic
- Exploring Code Canvas,
[project] weather-based transport recs for NYC
####DESCRIPTION
This is a short little experiment to fuse the forcast.io api with some public data about transportation possibilities in NYC. If the weather is nice, bike options are shown, if it's cold or rainy, subways are highlighted and "danger zones" for bikers centered around CityBike stations as a centroid are displayed, if the weather is "wintery mix" you are encouraged to seek a subway entrance.
For context a small div in the upper left displays the current temperature and precipitation type, if any for NYC's lat/long.
main.js hosts pretty much all the code that wires up the switches, so check it out for logic :).
NewerOlder