Finding good practice interview problems can be hard. Where should you begin?!
geluso
/ Practicing Whiteboard Problems.md
Last active
May 1, 2019 23:14
benmarwick
/ rotate-axis-labels-ggplot2.R
Last active
March 30, 2024 08:00
I can never remember how to rotate the x-axis labels with ggplot2: theme(axis.text.x = element_text(angle = 90, hjust = 1, vjust = 0.5))
This file contains bidirectional Unicode text that may be interpreted or compiled differently than what appears below. To review, open the file in an editor that reveals hidden Unicode characters.
Learn more about bidirectional Unicode characters
| # Adapted from https://stackoverflow.com/a/7267364/1036500 by Andrie de Vries | |
| # This is it: theme(axis.text.x = element_text(angle = 90, hjust = 1, vjust = 0.5)) | |
| library(ggplot2) | |
| td <- expand.grid( | |
| hjust=c(0, 0.5, 1), | |
| vjust=c(0, 0.5, 1), | |
| angle=c(0, 45, 90), |
hitvoice
/ plot_confusion_matrix.png
Last active
February 21, 2024 19:51
Generate matrix plot for confusion matrix with pretty annotations.

stripedpurple
/ O'Reilly Free Books
Last active
June 18, 2024 16:09
This file contains bidirectional Unicode text that may be interpreted or compiled differently than what appears below. To review, open the file in an editor that reveals hidden Unicode characters.
Learn more about bidirectional Unicode characters
| http://www.oreilly.com/data/free/files/2014-data-science-salary-survey.pdf | |
| http://www.oreilly.com/data/free/files/2015-data-science-salary-survey.pdf | |
| http://www.oreilly.com/data/free/files/Data_Analytics_in_Sports.pdf | |
| http://www.oreilly.com/data/free/files/advancing-procurement-analytics.pdf | |
| http://www.oreilly.com/data/free/files/ai-and-medicine.pdf | |
| http://www.oreilly.com/data/free/files/analyzing-data-in-the-internet-of-things.pdf | |
| http://www.oreilly.com/data/free/files/analyzing-the-analyzers.pdf | |
| http://www.oreilly.com/data/free/files/architecting-data-lakes.pdf | |
| http://www.oreilly.com/data/free/files/being-a-data-skeptic.pdf | |
| http://www.oreilly.com/data/free/files/big-data-analytics-emerging-architecture.pdf |
hrbrmstr
/ ahealth.md
Last active
June 30, 2019 12:09
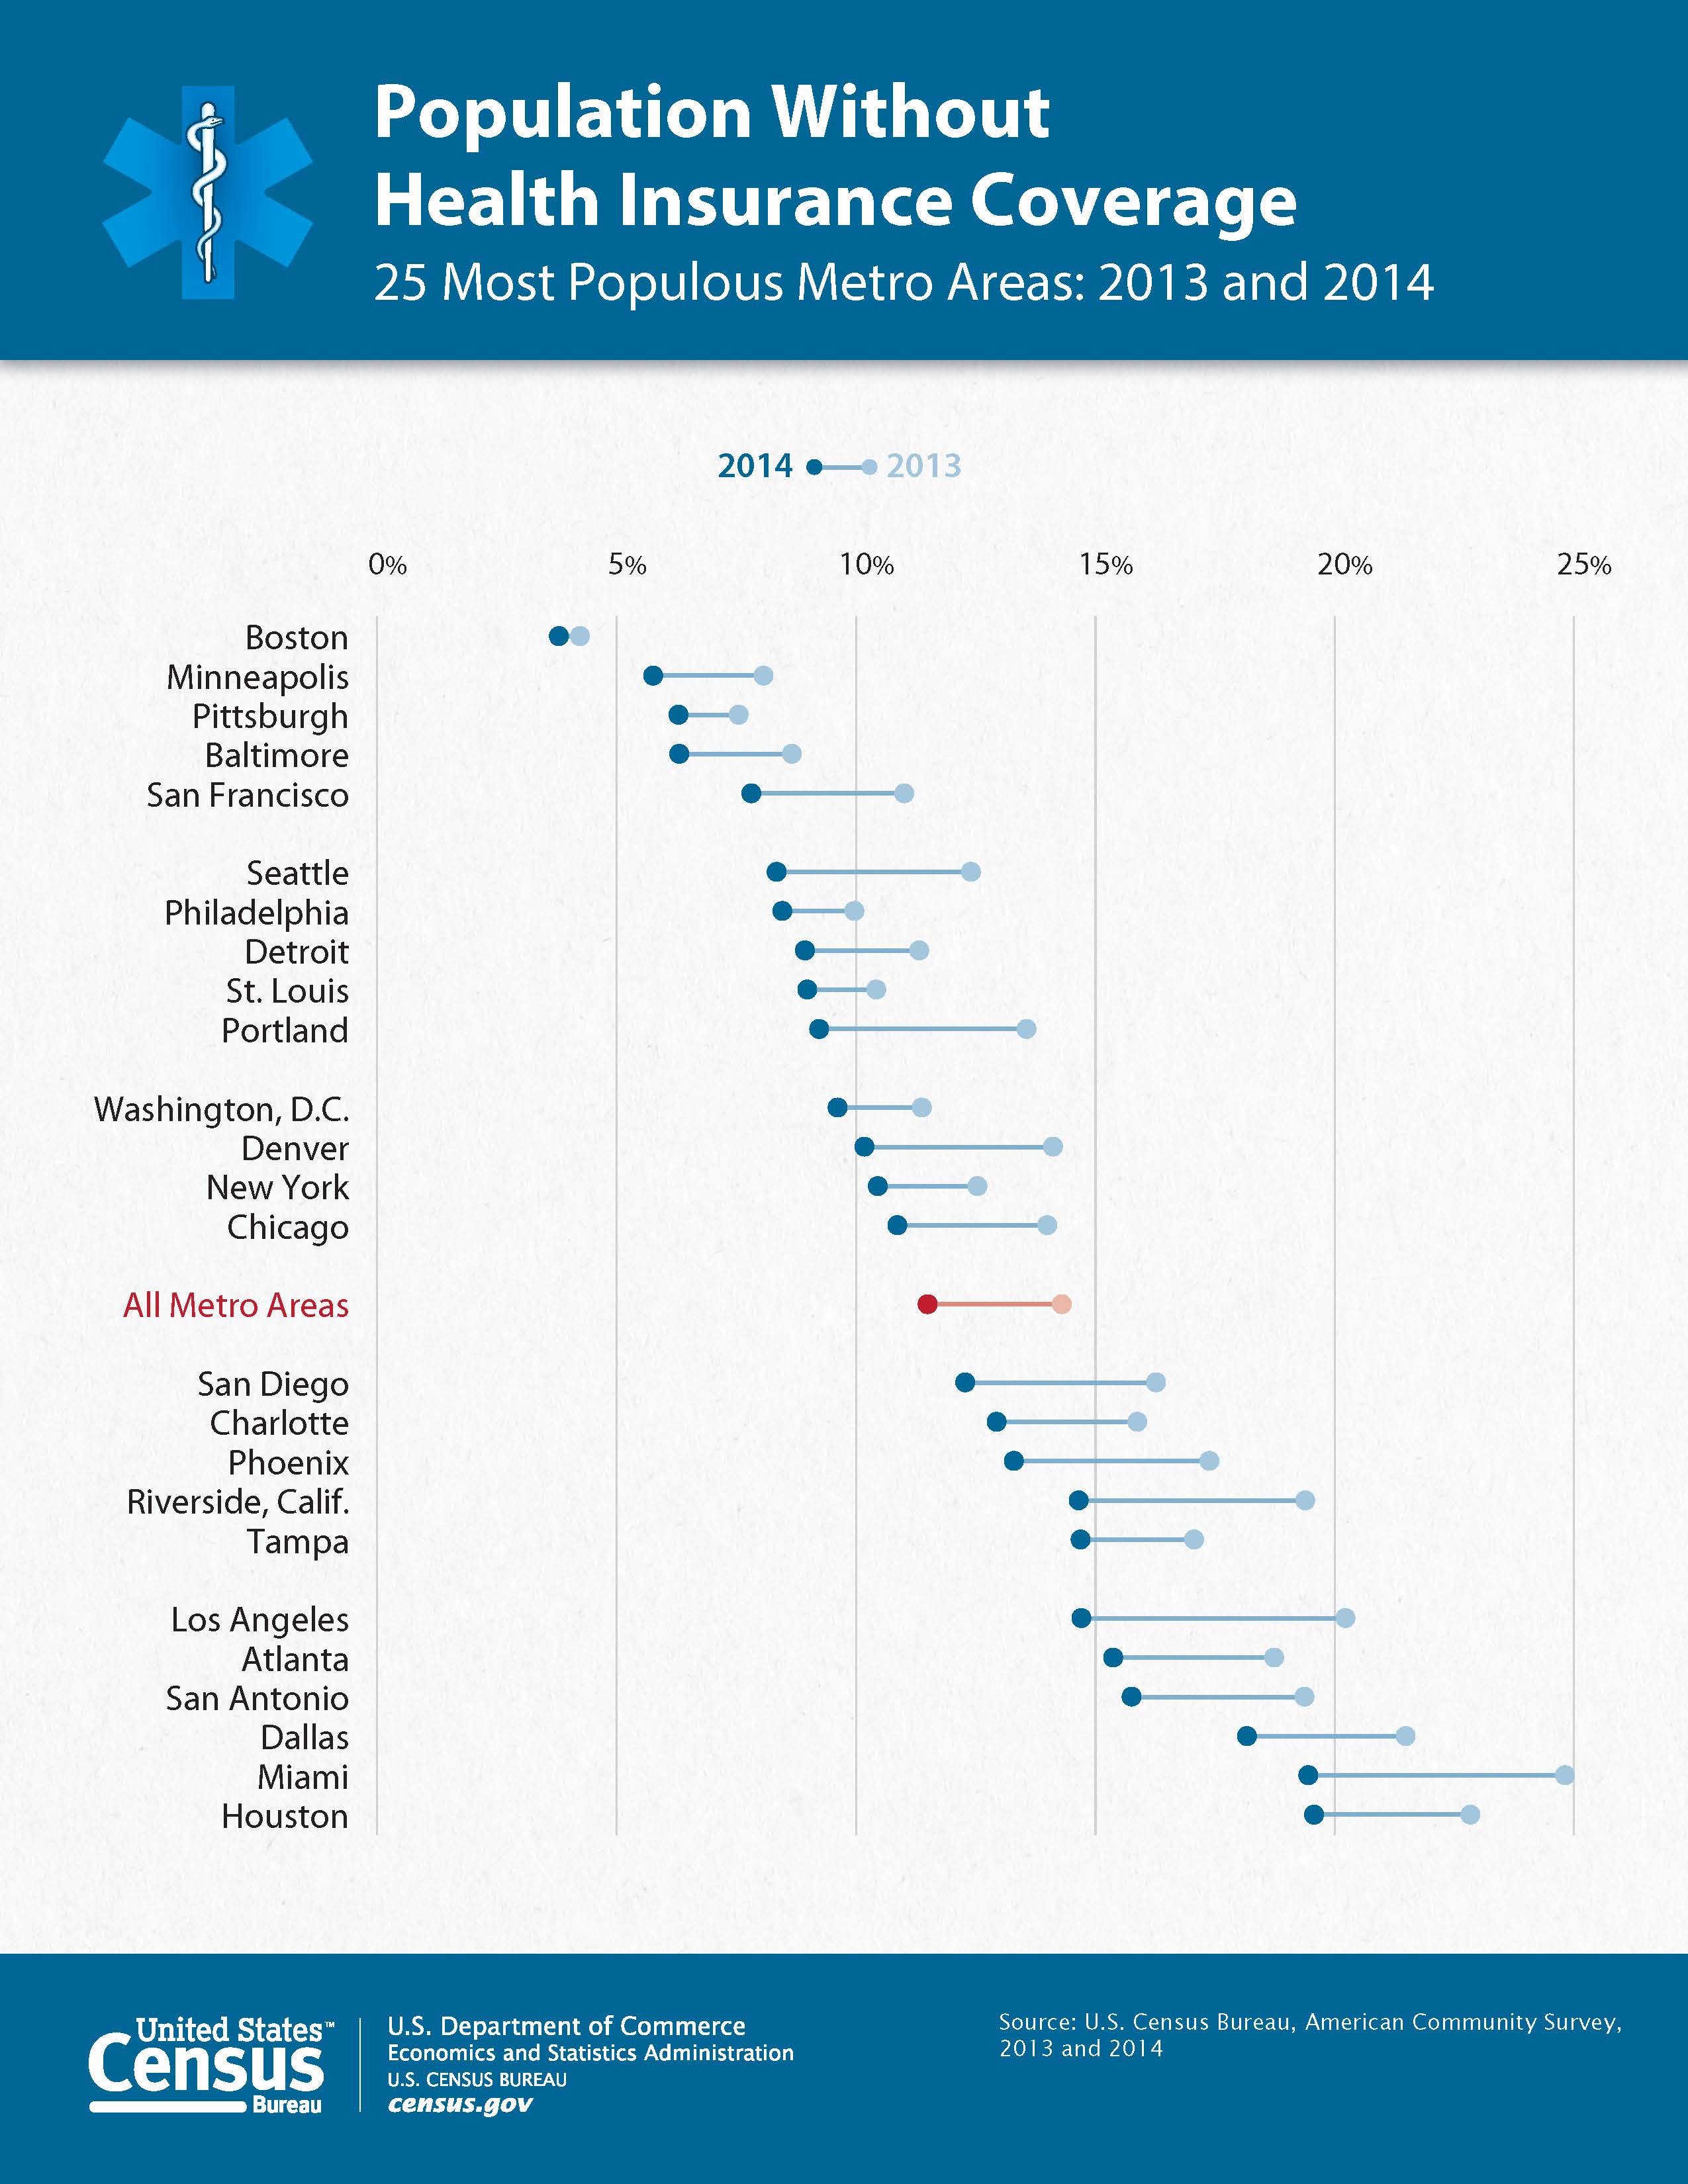
R+ggplot2 version of the "dumbbell" plot at http://census.gov/content/dam/Census/newsroom/releases/2015/cb15-158_graphic_acs_metro.jpg
This hit #rstats today:
Has anyone made a dumbbell dot plot in #rstats, or better yet exported to @plotlygraphs using the API? https://t.co/rWUSpH1rRl
— Ken Davis (@ken_mke) October 23, 2015So, I figured it was worth a cpl mins to reproduce.
While the US gov did give the data behind the chart it was all the data and a pain to work with so I used WebPlotDigitizer to transcribe the points and then some data wrangling in R to clean it up and make it work well with ggplot2.
It is possible to make the top "dumbbell" legend in ggplot2 (but not by using a guide) and color the "All Metro A
kinverarity1
/ loaded_modules.py
Last active
June 3, 2020 13:05
List loaded Python modules and packages, and show their version numbers and/or Git repository's HEAD commit SHA. Example: http://nbviewer.ipython.org/6038316/zz_example.ipynb
This file contains bidirectional Unicode text that may be interpreted or compiled differently than what appears below. To review, open the file in an editor that reveals hidden Unicode characters.
Learn more about bidirectional Unicode characters
| '''List loaded modules and packages, and show their version numbers | |
| and/or Git repository's HEAD commit SHA. | |
| ''' | |
| # Standard library modules | |
| import types | |
| # Third-party packages | |
| import git # GitPython |