Skip to content

Instantly share code, notes, and snippets.

@larahogan
Last active May 7, 2021 01:18
Show Gist options
  • Save larahogan/b681da601e3c94fdd3a6 to your computer and use it in GitHub Desktop.
Save larahogan/b681da601e3c94fdd3a6 to your computer and use it in GitHub Desktop.
Native app performance metrics

Native app performance metrics

This is a draft list of what we're thinking about measuring in Etsy's native apps.

Currently we're looking at how to measure these things with Espresso and Kif (or if each metric is even possible to measure in an automated way). We'd like to build internal dashboards and alerts around regressions in these metrics using automated tests. In the future, we'll want to measure most of these things with RUM too.

Overall app metrics

  • App launch time - how long does it take between tapping the icon and being able to interact with the app?
  • Time to complete critical flows - using automated testing, how long does it take a user to finish the checkout flow, etc.?
  • Battery usage, including radio usage and GPS usage
  • Peak memory allocation

Metrics per screen

  • Frame rate - we need to figure out where we're dropping frames (and introducing scrolling jank). We should be able to dig into render, execute, and draw times.
  • Memory leaks - using automated testing, can we find flows or actions that trigger a memory leak?
  • An app version of Speed Index - visible completion of the above-the-fold screen over time.
  • Time it takes for remote images to appear on the screen
  • Time between tapping a link and being able to do something on the next screen
  • Average time looking at spinners

Additional considerations

  • API performance
  • Webview Performance
@andydavies
Copy link

If you work out a way to get video off the device then this will calculate the SpeedIndex - https://github.com/WPO-Foundation/visualmetrics

ADB can be used to get the video in Android but don't think the libimobile people have worked out how to do it for iOS8 yet

@postwait
Copy link

postwait commented Mar 9, 2015

The team over at AT&T has thought a lot about this. It is worth reaching out to Michael Merritt to pick his brain on what they've done: http://www.research.att.com/people/Merritt_Michael/?fbid=eZmepfpOvRb

@mainroach
Copy link

Lots of thoughts here (all android specific).Generally your mobile perf problems revolve around : Rendering, Memory, Battery.

  • GCs-per-Action - GC events on android will be one of your most consistent eaters of performance.So you want to track GCs-per-action or some metric deriving similar.
  • memory going to bitmaps - On pre Lollipop devices, bitmaps are going to be a huge cause of performance . Knowing how many total MBs are being given to bitmaps is critial to understanding where frame pressure is coming from.
  • allocations per animation frame- Allocation in inner loops / animation frames can cause a huge amount of memory churn. Tracking memory allocations in inner loops is important.
  • network request frequency - The worst offenders for battery drain are screen-awake time, Wake-locks, and networking request frequency. For networking requests, you can track frequency / sizes to track if you're fully optimizing your networking hardware being awake, or if you're paying the penalty for it going to sleep.
  • render metrics - You can grab the amount of time that android is spending laying out/measuring/recording/xfering/executing using dumpsys gfxinfo; these are critical aspects of your rendering frame that you can track to determine when you go off the rails.
  • Overdraw - How many pixels per frame are overdrawn? That's wasted perf you've got there.

@guypod
Copy link

guypod commented Mar 10, 2015

Per the email thread we had, it may be worth separating out perf concepts from Native App-specific implementation. It would help dictate the general goals and allow analogies to the web metrics (for easier comparison and better communication). Once separated, we still need the focus to remain on the app piece, as that's a bigger gap in the industry today.

Similarly, I think Cole's comments are great, but require yet another level of depth as they delve into implementation. So maybe you need three tiers: Conceptual perf metrics (both app & web), App-Specific perf metrics, and Platform-specific perf metrics.

Smaller comments:

  • I think "time spent looking at spinners" is the same as "time form click to a usable next screen"
  • For app launch, maybe separate "first time app launch" (possibly also after an app update?) and second app launch? Sort of an indication of first & repeat view, tests use of caching, etc.
  • Offline behavior metrics - how long does it take to fail and/or give a usable screen?
  • (very) poor network reaction - how long does it take to timeout?
  • SPOF - flush out dependencies on specific requests which break/hang the app.
  • While important, I'm not sure battery usage & memory leaks fit under performance.

@larahogan
Copy link
Author

There is absolutely value in aligning web performance metrics with native app performance metrics. As a team of web performance engineers, it's been valuable having a mental model of human perception of speed, an understanding of networking, etc.

That being said, the stage that our team is in right now is attempting to, in an automated fashion, gather native app performance metrics. We've been able to wrap our heads around native enough to gather some performance benchmarks using the standard tools for Android and iOS. We've used our mental models of webperf to guide us so far. :) But unlike on the web, it seems like we're in a brave new world of measuring native app performance in an automated way. Like I said in the gist, we're hoping to alert on regressions and bring these metrics into dashboards so that we can, at a glance, understand the state of performance in our apps.

Guypo and Colt - can I volunteer you to write some articles on perf concepts and what's shared between apps and web? :D

In the meantime, I'd love to dig more into the actual implementation and what we should be collecting when we look at apps. To Colt's point in our email thread, we're a company in the trenches trying to figure out how to report on what our "system is doing, in a consumable way, rather than just generalizing the numeric output so that it can be shared across web/native." And we have our webperf mental models to guide us :)

In response to Guypo's smaller points:

  • "time spent looking at spinners" may be different than time from a tap to a next screen. On an infinite scrolling page, where we can predict when a user may hit the bottom and need to be shown more content, a spinner may appear. There may be no spinner between a navigation tap and a next screen being shown, but it may take a long time. In one case we've prepared for a user's perception of speed, but in another, we're just hoping that it kinda shows up instantly, and not taking the time to buffer the user's perception of speed.
  • that note about battery and memory leaks is definitely interesting. At this point, I think it makes sense for my team to own the reporting of these, but just like with other performance metrics, it likely won't be our team doing the fixing of bugs that we find.

Let me reframe the problem: we have a good grasp of how performance works on the web, and for humans. We've been able to apply that, at Etsy, to native apps - that's where the above list comes from. Once we get a canonical list in place (what am I missing that might be part of Guypo's first tier, "Conceptual perf metrics"?) then the team can work on gathering metrics in automated apps. But our problem right now is: can we measure these in an automated fashion? Can we report on these to help our product teams understand how their code changes impact the performance of the apps? I'd love to move the conversation (in this place, at least - I see tremendous value in more resources elsewhere for the venn diagrams in which native app and web perf overlap) toward concretely talking about the how.

@mainroach
Copy link

Hey Lara,
So, a couple more points wrt getting these statistics (again, talking about only the Android side of things)

  • Android doesn't currently have a central API for gathering counter statistics (like chrome does). As such, you end up needing to create an automation process, (like espresso / monkeyrunner) which can reproduce the test, while separate analysis is running. (e.g. Once for Traceview, Once for BatteryStats, Once for HeapManager, etc)
  • This creates a couple interesting problems with determinism (how can you be 100% sure that your app is responding the same way each run?)
  • This also creates interesting problems with recording overhead (Android's UIAutomator is not free...)
  • And worse, is how do you correlate these runs in a way that's meaningful to your engineering team?

To be clear, there's a lot of work here that needs to be done. Eventually, I'd love for these types of things to be rolled into Android's tooling.
In a super awesome happy fun fun world you'd be able to insert counters into your traceview/batterystats/heapmanager events that would correlate with the UIAutomator events, so that you could say "taking this action caused these performance events to occur"

From there, your CI tests become pretty straightforward. Design a typical user action flow, and for each user input (or system input, if you're using accelerator or something..). For each tooling system you're interested in gathering stats for, execute your test. A counter is associated with each event, for each file, and that way, at the end of it all, you can combine it into a single parsable timeline of performance across the test.

From there, standard data processing can help you understand flows/trends/commonality

@kennydee
Copy link

As i mentionned yesterday in my tweet, i think SPOF requests in native apps, are also something really important to check. I've seen so many apps, not loading because of synchronous requests on launch !

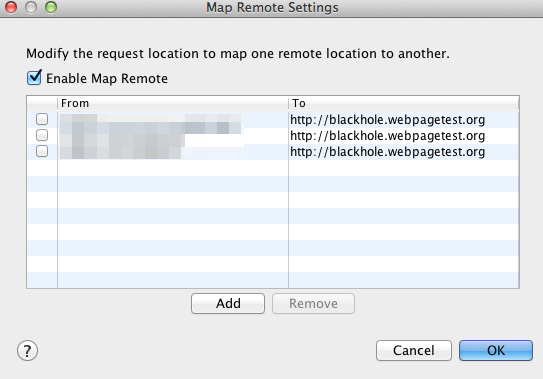
You could easily check SPOF request with a proxy software like CharlesProxy, by redirecting domains to http://blackhole.webpagetest.org and see if your app crashes, or is waiting for the request to timeout (75sec on iOS !).
You could do that with the
CharlesProxy Map Remote

I previously write an article (in french sorry), on that topic : [http://tech.m6web.fr/performances-web-disaster-case-applications-mobile-native/](Perf & Web Disaster case on mobile apps)

@mfcampos
Copy link

Hi,
I would add metrics regarding the amount of data being transferred.

I can't really help much with the how, but I do believe that though some metrics aren't directly performance metrics they could be indicative of performance issues and therefore would be useful to measure anyway: battery usage, memory usage/leaks, load, etc.

I do worry about what the performance impact of measuring all this will be though.

Cheers!

@stuartphilp
Copy link

obviously loading times, animations/transition framerates, resource usage. the most important to me is probably network usage (i'm in bad coverage areas frequently):

I would look at things like frequency (how often an external request is made), average time to completion, time between requests, and bytes downloaded. you need to keep in mind the audience (mobile/commuters/cell-network based, home/office/wifi-based) for the app, and make sure your using the network efficiently. batching requests, not keeping the device active and draining battery, delivering an experience to the user that lets them enjoy the app even on poor networks.

@lafikl
Copy link

lafikl commented Mar 11, 2015

Native mobile performance is different than mobile web, and must be approached in a different way.
The native mobile perf (From now on i'll call it mobile perf, for brevity sake) is more about being adaptable to the conditions you're in at the moment.
Also, you need to keep in mind that the conditions are more likely to change while the user is using your (Switching cell towers, Subway tunnels...etc). A user can start a session with a great LTE connection but maybe at the middle of the session he/she moved into another room and switched to 2G.

The great thing about native apps, is that you gain access to the OS APIs, like connection type, background sync.
Which means that apps can and needs to be reactive to these kinds of changes.

Defensive patterns:


Network

As explained above the network on mobile devices are more hostile than they're on desktops.
Therefore, the network layer needs to abstracted by a library that gaurds the developer and user from such changes. (Think of it like Netflix's Hystrix project but done on both client and back-end side.)

  • Circuit Breaker:
    In the context of mobile: You can use this patterns to turn off sending requests to the upstream server if it's timing-out or not responding in a timely manner.
  • Adaptive upstream responses: Server responses should be tailored based on the conditions of the user connection. Think of it like cutting the mustard technique, but the check must done continuously by listening to the system notifications, using something like https://github.com/tonymillion/Reachability/.

Perceived Performance

  • Speed index. can be done by using ADB to start recording the screen and Appium to automate the UI task, then pull the file by ADB.
  • Optimistic UI. It's best explained by Rauch and the folks at Instagram 1 2 3

RUM Metrics to keep track of

  • Content size downloaded per session per type of content.
  • Percentage of types of networks used by users.
  • Median/Percentiles of network latency.
  • Time it takes app the to be interactive when launched, per session.
  • Number of requests per session.
  • Local cache hits per session.
  • How often does the connection change in a session.

This is just the first draft, i might update it later.

-KL

@colinbendell
Copy link

Lots of good content and ideas here. It's important to note that there are different audiences looking for app performance data. Each audience has a slightly different pivot from the necessary data - and each likely could have levels as guypo suggests.

One audience who is interested in how the app performs from action to action. How long does it take to load the app? How long does it take for the animation to complete? How much cpu, memory are used for an action? etc.

The second audience are those connected to network activities. User does X, causes Y network request(s), results in Z display change. In this scenario we are looking at it very much in the same light as web page timings. In fact most of the existing w3c spec would naturally apply here. You want to capture all the nitty gritty things like dns time, ttfb, and finish animations. For this audience some interesting things to track would include:

  • Signal strength, tower id, gps coordinates
  • number of message retries; number of failed attempts for content
  • connection pool utilization (is this a new connection, or re-using a connection)

There is a third audience here as wel:. Those that are concerned about the impact of usability and usage of the app. How much time does the user spend in the app. What is the abandonment rate? In the world of web, there are many incidental artifacts that allow us to track (from logs) the users progress through a transaction (finding an item, putting it in the cart, checking out, etc). With native apps, these loggable artifacts aren't always available and therefore require more explicit capture and beaconed back.

/colin

@glureau
Copy link

glureau commented Jan 25, 2016

Hi guys!

Is there some improvements on this topic?
I search (but didn't find) a tool that could ensure we are not lowering our app performance (network/DB/io(sdcard)/memory/cpu) when merging new features.

Greg

@sharifsakr
Copy link

Hi Lara,

Sorry to plug my own product, but it might be worth taking a look at GameBench: www.gamebench.net

Although we originally built the tool for gaming, it's increasingly being used to measure app responsiveness and UX, including many of the metrics you list (fps, memory, battery).

By way of an illustration, you can see an article about using GameBench to measure the responsiveness of news reader apps here: https://www.gamebench.net/blog/case-study-news-apps-and-quest-extreme-responsiveness

We're also gradually adding ways to red-flag excessive wait times, especially by means of GameBench Automation (still currently in closed beta, but you're welcome to try it).

@ppcuenca
Copy link

ppcuenca commented Mar 1, 2017

Hi,

Great discussion. I realize this is more than a year old now, but has anyone come across any more tools or methods to measure and maybe benchmark rendering in native mobile.

I am going to give the visual metrics video measurement from https://github.com/WPO-Foundation/visualmetrics a try.

Has anyone had any luck with this?

Thanks,

@foobargeez
Copy link

Nice thread. Does anyone have any pointers/product suggestions on how to measure mobile app performance?

Thanks!

@enguyen
Copy link

enguyen commented Feb 26, 2019

Just wanted to share this resource: User-centric performance metrics

I found this to be a very powerful, perception-centered, and platform-independent way of thinking about app performance. I'd love everyone's help in thinking through how these should map to lower-level performance metrics, however. Here's how far I've gotten:

The experience Notes Metric
Is it happening? Did the navigation start successfully? Has the server responded? First Paint (FP) / First Contentful Paint (FCP) / Measuring any jank related to loading spinners or scrolling while UI is "busy"
Is it useful? Has enough content rendered that users can engage with it? First Meaningful Paint (FMP) / Hero Element Timing / Speed index and also the link above from @andydavies
Is it usable? Can users interact with the page, or is it still busy loading? Time to Interactive (TTI) / Not sure of native app metric...
Is it delightful? Are the interactions smooth and natural, free of lag and jank? Long Tasks (technically the absence of long tasks) / Frame rate / Jank per session (number of clusters of dropped frames per user session?)

Sign up for free to join this conversation on GitHub. Already have an account? Sign in to comment