Generating a graphviz dot file equivalent to the mol file of pred(3) in chemlambda v2: pred_3.mol (original name was erroneous)
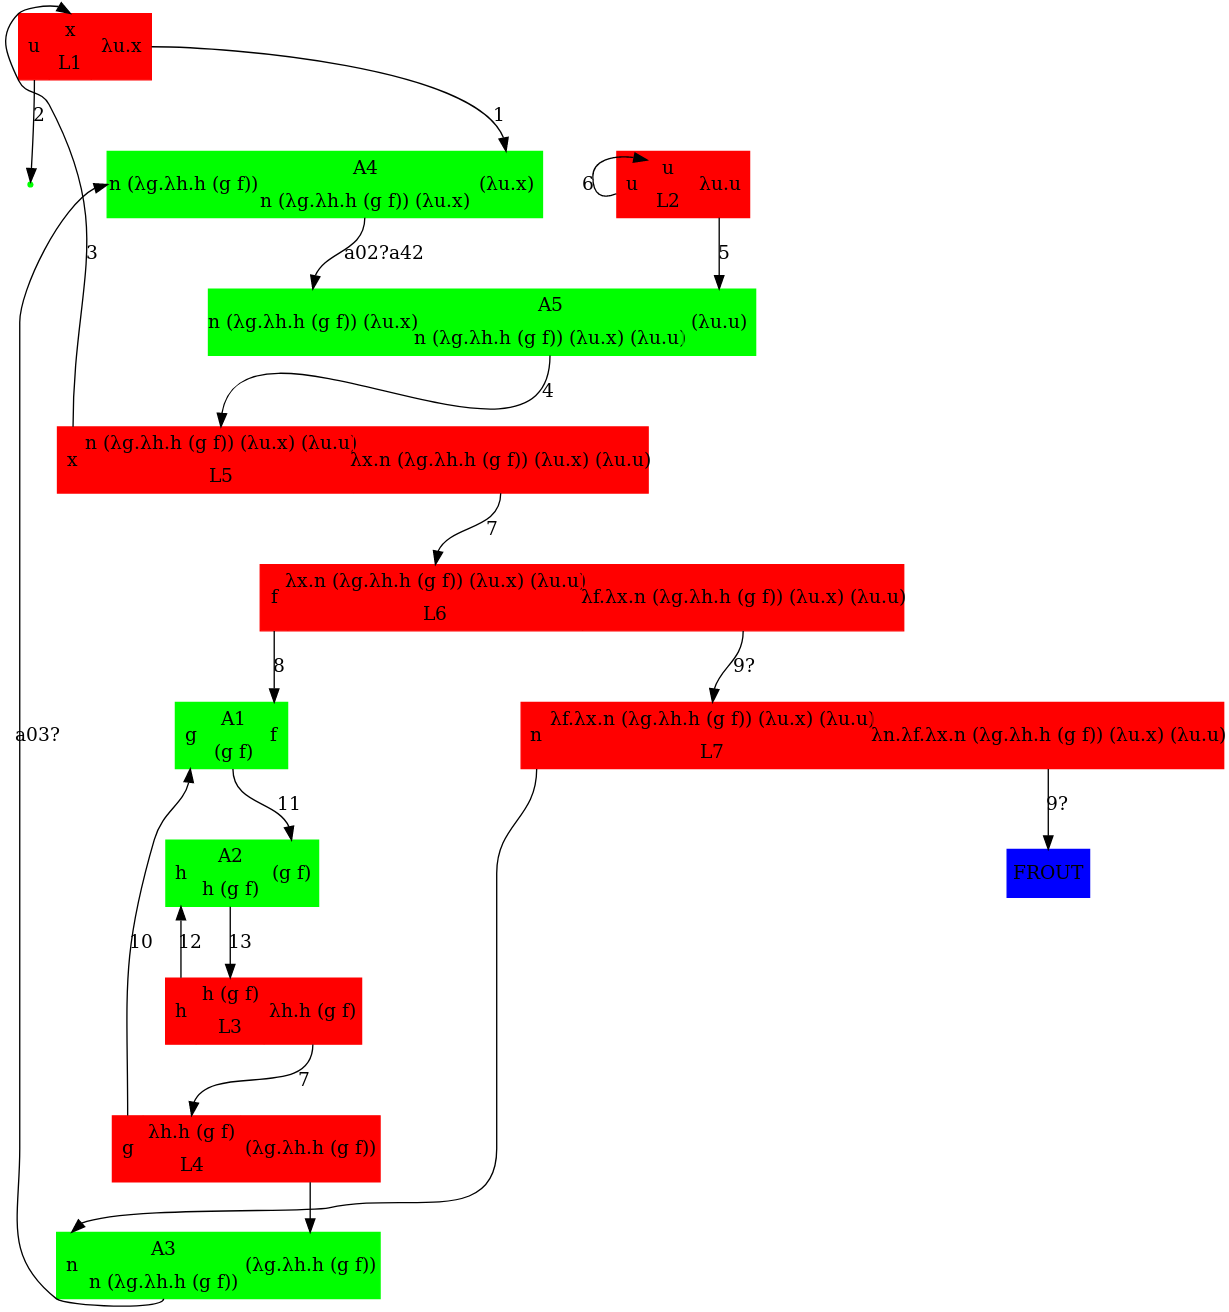
The lambda calculus expression for pred(3) (predecessor(3) == 2) is PRED := λn.λf.λx.n (λg.λh.h (g f)) (λu.x) (λu.u) (ref wikipedia)
Writing the above expression as nodes in a graph leads to the below graph. The corresponding dot file was written manually and available further below in this gist. An annotated version of pred_3.mol to help compare it to pred_3.dot is available further below in this gist.
To generate the dot file automatically from lambda terms, check http://www.teamshadi.net/chemlambda-js/ (a fork from this jsfiddle ). Its current output for pred(3) matches with the manually specified graph below.
Version 4 (2019-04-11): shifted indeces back by 1 (e.g. L1 to L0) to match with the auto-generated graph from here

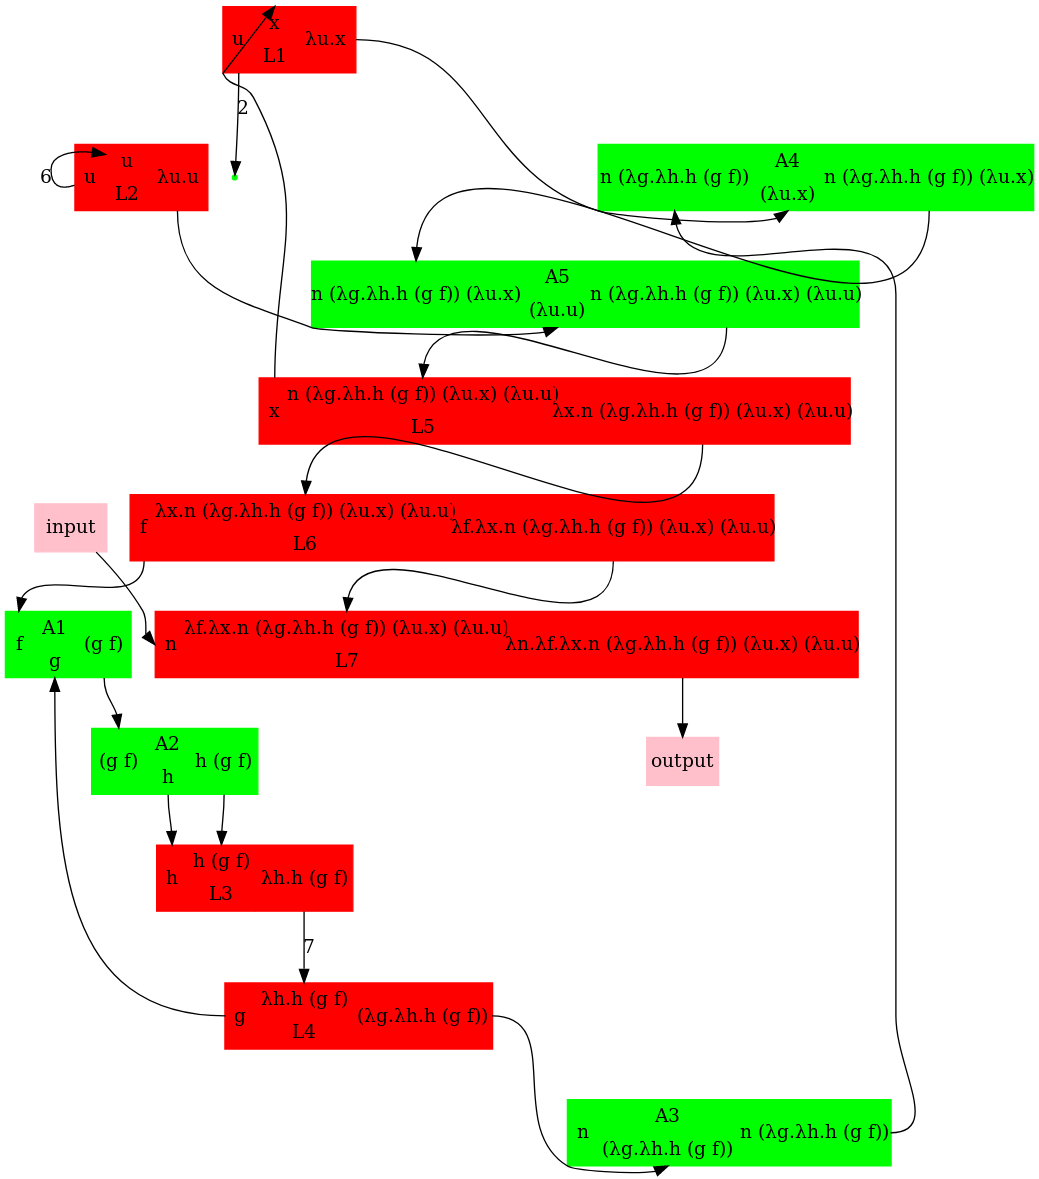
Compare the above graph to the chemlambda d3.js graph for pred_3.mol here
To experiment with graphviz, use
http://www.webgraphviz.com/ or
https://dreampuf.github.io/GraphvizOnline
http://viz-js.com/
Notes:
- This work was prompted from chamlambda issue #6
- Older versions of graphs:
-
Version 3 (2019-04-09):
-
Version 2 (2019-04-07):
Thanks @mbuliga for your corrections:
A a b c == A li ri mo,L a b c == L mi lo ro, ...The above points you highlighted are fixed now. Do you mind checking again if I missed anything?
I'm sure that I am still missing something because I do not match 100% with the d3.js visualization of
pred(3)that you have here. For example, I'm not sure where myL2, L4, L7? A3, A4?are on your d3.js graph. Also, the edgesa02, a42, a03from your mol file are not clear to me where they belong in my graph.