Last active
June 19, 2024 13:37
-
-
Save katef/fb4cb6d47decd8052bd0e8d88c03a102 to your computer and use it in GitHub Desktop.
This file contains bidirectional Unicode text that may be interpreted or compiled differently than what appears below. To review, open the file in an editor that reveals hidden Unicode characters.
Learn more about bidirectional Unicode characters
| #!/usr/bin/awk -f | |
| # This program is a copy of guff, a plot device. https://github.com/silentbicycle/guff | |
| # My copy here is written in awk instead of C, has no compelling benefit. | |
| # Public domain. @thingskatedid | |
| # Run as awk -v x=xyz ... or env variables for stuff? | |
| # Assumptions: the data is evenly spaced along the x-axis | |
| # TODO: moving average | |
| # TODO: trend lines, or guess at complexities | |
| # TODO: points vs. lines | |
| # TODO: colourblind safe scheme | |
| # TODO: center data around the 0 axis | |
| # TODO: scanning for all float formats input, including -inf, NaN etc | |
| # TODO: guess at whether to use lines or circles, based on delta within a window? | |
| function hastitle() { | |
| for (i = 1; i <= NF; i++) { | |
| if ($i ~ /[^-0-9.]/) { | |
| return 1 | |
| } | |
| } | |
| return 0 | |
| } | |
| function amax(a, i, max) { | |
| max = -1 | |
| for (i in a) { | |
| if (max == -1 || a[i] > a[max]) { | |
| max = i | |
| } | |
| } | |
| return max | |
| } | |
| function normalise( delta) { | |
| for (i = 1; i <= NF; i++) { | |
| max[i] = 0 | |
| min[i] = 0 | |
| for (j = 1; j <= NR; j++) { | |
| if (a[i, j] > max[i]) { | |
| max[i] = a[i, j] | |
| } else | |
| if (a[i, j] < min[i]) { | |
| min[i] = a[i, j] | |
| } | |
| } | |
| delta[i] = max[i] - min[i] | |
| for (j = 1; j <= NR; j++) { | |
| a[i, j] -= min[i] | |
| if (delta[i] > 0) { | |
| a[i, j] /= delta[i] | |
| } | |
| } | |
| } | |
| # TODO: rescale to center around 0 | |
| # Here the data is squished slightly in descending order of deltas. | |
| # Each column is scaled independently anyway, so they're never to scale. | |
| # The idea here is to help show intutively which are smaller, but without | |
| # actually drawing them to size (since then very small deltas would not be | |
| # visible at all). | |
| k = 0 | |
| prev = -1 | |
| while (length(delta) > 0) { | |
| i = amax(delta) | |
| # Several columns can share the same delta | |
| # Formatting to %.3f here is just for sake of rounding | |
| if (prev != -1 && sprintf("%.3f", prev) != sprintf("%.3f", delta[i])) { | |
| k++ | |
| } | |
| # +2 to squish things upwards a bit | |
| scale = (NF + 2 - k) / (NF + 2) | |
| # there's no need to scale by 1 | |
| if (scale != 1) { | |
| for (j = 1; j <= NR; j++) { | |
| a[i, j] *= scale | |
| } | |
| } | |
| prev = delta[i] | |
| delete delta[i] | |
| } | |
| } | |
| # internal coordinates to svg coordinates | |
| function point(x, y) { | |
| x = x * (chart_width - 2 * xmargin) + xmargin | |
| y = (height - 2 * ymargin) - y * (height - 2 * ymargin) + ymargin | |
| return sprintf("%u,%u", x, y) | |
| } | |
| function line(i) { | |
| printf " <polyline stroke='%s%s' stroke-width='1.5' fill='none'", color[i], alpha | |
| printf " points='" | |
| for (j = 1; j <= NR; j++) { | |
| printf "%s ", point((j - 1) / NR, a[i, j]) | |
| } | |
| printf "'/>\n" | |
| } | |
| function circles(i) { | |
| for (j = 1; j <= NR; j++) { | |
| p = point((j - 1) / NR, a[i, j]) | |
| split(p, q, ",") | |
| printf " <circle cx='%u' cy='%u' r='1.2' fill='%s%s' stroke='%s%s'/>\n", | |
| q[1], q[2], color[i], alpha, color[i], alpha | |
| } | |
| } | |
| function legend_text(i, title) { | |
| printf " <g transform='translate(%u %u)'>\n", chart_width + gutter, i * line_height | |
| printf " <circle cx='%d' cy='%d' r='3.5' fill='%s' stroke='%s'/>\n", | |
| -10, -line_height / 2 + 5, color[i], color[i] | |
| printf " <text style='%s' xml:space='preserve'>%-*s[%.3g, %.3g]</text>\n", | |
| sprintf("fill: %s; font-size: %upx; font-family: mono", fg, font_size), | |
| (title_width > 0) ? title_width + 1 : 0, title, min[i], max[i] | |
| printf " </g>\n" | |
| } | |
| function display() { | |
| print "<?xml version='1.0'?>" | |
| printf "<svg xmlns='%s' width='%u' height='%u' version='1.1'>\n", | |
| "http://www.w3.org/2000/svg", | |
| chart_width + gutter + legend_width, height | |
| title_width = 0 | |
| for (i = 1; i <= NF; i++) { | |
| if (length(title[i]) > title_width) { | |
| title_width = length(title[i]) | |
| } | |
| } | |
| for (i = 1; i <= NF; i++) { | |
| # line(i) | |
| circles(i) | |
| } | |
| if (length(title)) { | |
| for (i = 1; i <= NF; i++) { | |
| legend_text(i, title[i]) | |
| } | |
| } | |
| print "</svg>" | |
| } | |
| NR == 1 { | |
| if (hastitle()) { | |
| for (i = 1; i <= NF; i++) { | |
| title[i] = $i | |
| } | |
| NR-- | |
| next | |
| } | |
| } | |
| { | |
| for (i = 1; i <= NF; i++) { | |
| a[i, NR] = $i | |
| } | |
| } | |
| END { | |
| fg = "#eeeeee" | |
| alpha = "ff" | |
| # Bang Wong's colour-safe palette, https://www.nature.com/articles/nmeth.1618 | |
| # (using just the last five colours) | |
| color[3] = "#009E73" | |
| color[2] = "#F0E442" | |
| color[1] = "#0072B2" | |
| color[4] = "#CC79A7" | |
| color[5] = "#D55E00" | |
| color[6] = fg | |
| if (NF == 1) { | |
| color[1] = fg | |
| } | |
| if (NF > length(color)) { | |
| print "too many fields" >> "/dev/stderr" | |
| exit 1 | |
| } | |
| chart_width=320 | |
| legend_width=300 | |
| height=120 | |
| xmargin=0 | |
| ymargin=5 | |
| gutter=30 | |
| font_size=15 | |
| line_height=20 | |
| # the data is scaled 0..1 for our internal coordinate space | |
| normalise() | |
| display() | |
| } |
Author
katef
commented
Jul 24, 2020

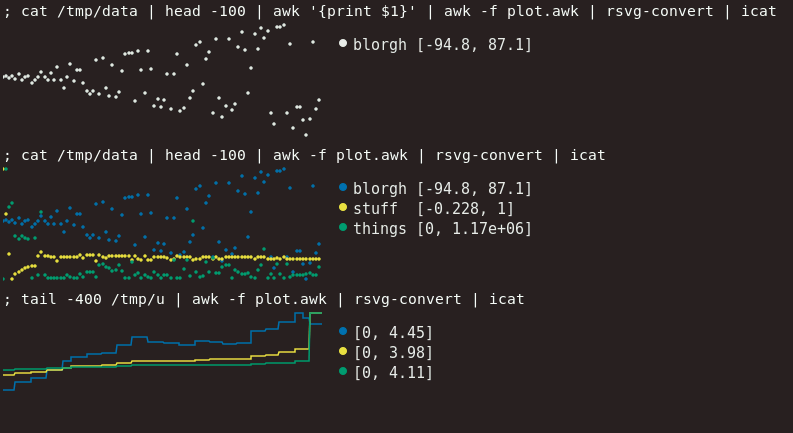
Optional titles are detected from the data (in TSV format), when present:
; head -5 /tmp/data
blorgh stuff things
0 1 0
1.40159 0.495601 1172922
-1.3012 0.0455791 761306
1.69096 -0.227783 800372
Now with (hopefully) colourblind-friendly colours. Colours are only used when there's more than one column to show.
Sorry for newb question: icat was totally new to me... is this using https://github.com/kovidgoyal/kitty or something else?
Yes, that's a shell alias to kitty icat
Alter lines 151/152 to swap between lines and dots.
Sign up for free
to join this conversation on GitHub.
Already have an account?
Sign in to comment