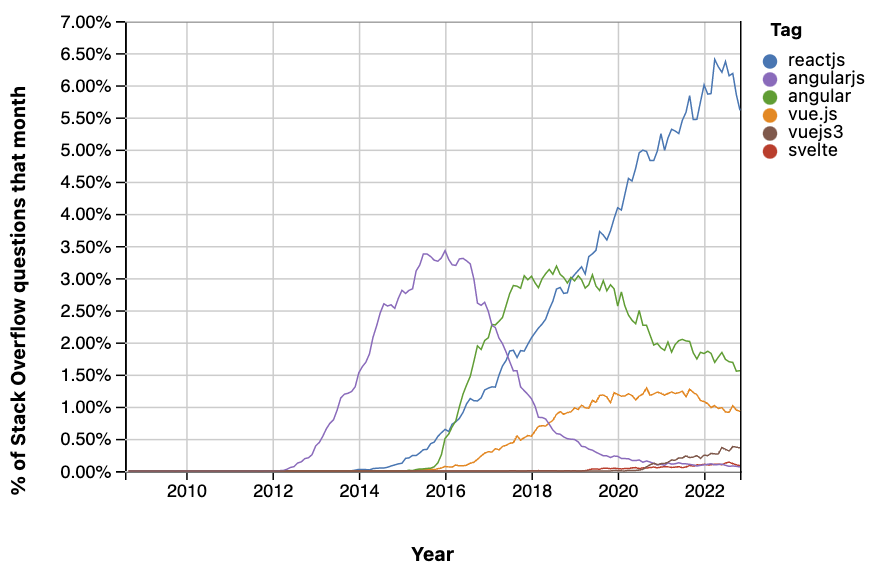
Charts are from different sources and thus colors are inconsistent, please carefully read the chart's legends.
Like this? Check React Native vs Flutter: https://gist.github.com/tkrotoff/93f5278a4e8df7e5f6928eff98684979
| // helps us in parsing the frontmatter from text content | |
| const matter = require('gray-matter') | |
| // helps us safely stringigy the frontmatter as a json object | |
| const stringifyObject = require('stringify-object') | |
| // helps us in getting the reading time for a given text | |
| const readingTime = require('reading-time') | |
| // please make sure you have installed these dependencies | |
| // before proceeding further, or remove the require statements | |
| // that you don't use |
Charts are from different sources and thus colors are inconsistent, please carefully read the chart's legends.
Like this? Check React Native vs Flutter: https://gist.github.com/tkrotoff/93f5278a4e8df7e5f6928eff98684979
Your task: write a script to get a nice CSV file of natural gas prices.
Please publish your results in a git repo or a gist. Please include both script and your resulting data -- so the CSV files should be stored in the repo too!
More detail:
| # This is an alternate proposal for a metadata structure for OpenSpending | |
| # data models. The most significant change is that data is modelled in a | |
| # way that highlights logical connections between fields, rather based on | |
| # columns. This also means that column naming conventions are not needed. | |
| # | |
| # This proposal uses YAML to represent the model, but implementations | |
| # would probably use JSON instead. | |
| # The proposed format is currently supported by spendb and cubepress. | |
| # | |
| # The following is a data model for a fictitious budget/spending dataset. |
| // replace this with your CKAN website | |
| var ckanSite = 'http://datahub.io' | |
| var sql = 'Your SQL goes here'; | |
| // ================= | |
| // Using jQuery only | |
| // ================= | |
| var data = encodeURIComponent(JSON.stringify({sql: sql})); |
HDX Common Humanitarian Dataset data into CKAN instance (we used datahub.io for convenience).
http://datahub.io/dataset/hdx-common-humanitarian-dataset
We've loaded (indicator) value table and indicator table separately in the CKAN DataStore (we have not bothered loading dataset table for the present) and we've also created a python script to automate this (which can also serve as an example of how to work with CKAN API).
Setting this up was pretty fast (most of the work was actually tidying up the data and then making some scripts to make this repeatable and testable).
README is empty
| // Main containers | |
| .container | |
| @include outer-container | |
| // Rows | |
| .row | |
| @include row() | |
| // A basic column without a defined width or height |
| 2010-11-P01.csv:4:Vendor,Expense Description,Amount,Doc No,,,^M | |
| 2010-11-P02.csv:6:Vendor,Expense Description,Amount,Doc No,,,^M | |
| 2010-11-P03.csv:6:Document No","Amount | |
| 2010-11-P04-500.csv:1:Vendor ID,Vendor Name,Cost Element,Expenditure Account Code Description,SAP Document No,Amount £,Clearing Date^M | |
| 2010-11-P05-500.csv:1:Vendor ID,Vendor Name,Cost Element,Expenditure Account Code Description,SAP Document No,Amount £,Clearing Date^M | |
| 2010-11-P06-500.csv:1:Vendor ID,Vendor Name,Cost Element,Expenditure Account Code Description,SAP Document No,Amount £,Clearing Date^M | |
| 2010-11-P07-500.csv:1:Vendor ID,Vendor Name,Cost Element,Expenditure Account Code Description,SAP Document No,Amount £,Clearing Date^M | |
| 2010-11-P08-500.csv:1:Vendor ID,Vendor Name,Cost Element,Expenditure Account Code Description,SAP Document No,Amount £,Clearing Date^M | |
| 2010-11-P09-500.csv:1:Vendor ID,Vendor Name,Cost Element,Expenditure Account Code Description,SAP Document No,Amount £,Clearing Date^M | |
| 2010-11-P10-500.csv:1:Vendor ID,Vendor Name,Cos |
Additions wanted - please just fork and add.