-
-
Save rougier/e5eafc276a4e54f516ed5559df4242c0 to your computer and use it in GitHub Desktop.
| # ----------------------------------------------------------------------------- | |
| # From https://en.wikipedia.org/wiki/Minkowski–Bouligand_dimension: | |
| # | |
| # In fractal geometry, the Minkowski–Bouligand dimension, also known as | |
| # Minkowski dimension or box-counting dimension, is a way of determining the | |
| # fractal dimension of a set S in a Euclidean space Rn, or more generally in a | |
| # metric space (X, d). | |
| # ----------------------------------------------------------------------------- | |
| import scipy.misc | |
| import numpy as np | |
| def fractal_dimension(Z, threshold=0.9): | |
| # Only for 2d image | |
| assert(len(Z.shape) == 2) | |
| # From https://github.com/rougier/numpy-100 (#87) | |
| def boxcount(Z, k): | |
| S = np.add.reduceat( | |
| np.add.reduceat(Z, np.arange(0, Z.shape[0], k), axis=0), | |
| np.arange(0, Z.shape[1], k), axis=1) | |
| # We count non-empty (0) and non-full boxes (k*k) | |
| return len(np.where((S > 0) & (S < k*k))[0]) | |
| # Transform Z into a binary array | |
| Z = (Z < threshold) | |
| # Minimal dimension of image | |
| p = min(Z.shape) | |
| # Greatest power of 2 less than or equal to p | |
| n = 2**np.floor(np.log(p)/np.log(2)) | |
| # Extract the exponent | |
| n = int(np.log(n)/np.log(2)) | |
| # Build successive box sizes (from 2**n down to 2**1) | |
| sizes = 2**np.arange(n, 1, -1) | |
| # Actual box counting with decreasing size | |
| counts = [] | |
| for size in sizes: | |
| counts.append(boxcount(Z, size)) | |
| # Fit the successive log(sizes) with log (counts) | |
| coeffs = np.polyfit(np.log(sizes), np.log(counts), 1) | |
| return -coeffs[0] | |
| I = scipy.misc.imread("sierpinski.png")/256.0 | |
| print("Minkowski–Bouligand dimension (computed): ", fractal_dimension(I)) | |
| print("Haussdorf dimension (theoretical): ", (np.log(3)/np.log(2))) |
Hi there,
I would like to know that what is the use of threshold=0.9 value, why we are using this value.
Better to use imageio.imread in line 52 as imread is deprecated in SciPy 1.0.0.
Does this code work? I have tried running it on a 2D box generated as follows:
seg = np.zeros(shape = (100,100))
seg[20:80,20:80] = 1.0
The function returned 'nan'. I was expecting something close to 2.0.
When I ran it on an irregular segmentation, I got fractal dimensions between 0.45 - 0.9. The reference values I found in the literature for the same type of segmentation are around 1.2.
Do you have the log (reason for NaN)?
When I run this:
`seg = np.zeros(shape = (100,100))
seg[20:80,20:80] = 1.0
fractal_dimension(seg)`
In a Jupyter notebook I get
"RuntimeWarning: divide by zero encountered in log
plt.plot(np.log(sizes), np.log(counts))"
It seems there is a problem with trying to fit nearly linear data.
Hi,
I looked at this a bit more today. the problem is one of the "counts" is 0 so log(counts) = -inf :
counts =
[1.38629436 2.7080502 2.99573227 3.68887945 -inf]
I can remove the -inf term using this:
x = np.log(sizes)
y = np.log(counts)

mask = ~np.isinf(y)

x = x[mask]
y = y[mask]

coeffs = np.polyfit(x, y, 1)

return -coeffs[0]
The result is I get D = 1.038. I was expecting it to be closer to 2.
Yes, I would have expected 2. Do you have by any change a reference implementation somewhere such that we can check?
Here is the code I'm using :
https://repl.it/repls/AlarmingHarmlessScience
Thank you for your help with this!!
Looking at https://en.wikipedia.org/wiki/Minkowski%E2%80%93Bouligand_dimension, I think I may have computer the dimension of the border and not the actual shape because I filtered out the full boxes. This may explain why the result is 1.
If I run on a rectangle, I get something around 0.55. I think it should be pretty close to either 1 or 2 depending how you did it. To be honest I haven't had time to review your code in depth. I am actually analyzing a 3D shape and using fractal dimension as a measure of surface irregularity, so I'm using a 3D fractal dimension code I found elsewhere for that. So this is not a high priority for me. However I thought it might be worth looking at the fractal dimension for 2D slices of the object as well.
I am getting this error message when executing this programme in PyCharm.
1)"AttributeError: module 'scipy.misc' has no attribute 'imread'"
2) "AttributeError: module 'scipy' has no attribute 'misc'"
@akshahi17 Probably the imread function has been deprecated in scipy. You cn now use the imageio library instead.
Hi, I was testing it on some fractals with defined dimensions, below is my code. The problem is that it's far from the dimensions and even for the same fractal in a different rotation (Sherpinski), it is not giving the same values (which I believe should, this should be independent of rotation). Where is the problem?
Also, I believe that it should go to squares 2x2, that is:
sizes = 2**np.arange(n, 2, -1) should become sizes = 2**np.arange(n, 0, -1).
Source:
https://en.wikipedia.org/wiki/Sierpi%C5%84ski_carpet
https://en.wikipedia.org/wiki/Koch_snowflake
# -----------------------------------------------------------------------------
# From https://en.wikipedia.org/wiki/Minkowski–Bouligand_dimension:
#
# In fractal geometry, the Minkowski–Bouligand dimension, also known as
# Minkowski dimension or box-counting dimension, is a way of determining the
# fractal dimension of a set S in a Euclidean space Rn, or more generally in a
# metric space (X, d).
# -----------------------------------------------------------------------------

import numpy as np
import matplotlib.pyplot as plt

def fractal_dimension(Z, threshold=0.9):

    # Only for 2d image
    assert(len(Z.shape) == 2)

    # From https://github.com/rougier/numpy-100 (#87)
    def boxcount(Z, k):
        S = np.add.reduceat(
            np.add.reduceat(Z, np.arange(0, Z.shape[0], k), axis=0),
                               np.arange(0, Z.shape[1], k), axis=1)

        # We count non-empty (0) and non-full boxes (k*k)
        return len(np.where((S > 0) & (S < k*k))[0])


    # Transform Z into a binary array
    Z = (Z < threshold)

    # Minimal dimension of image
    p = min(Z.shape)

    # Greatest power of 2 less than or equal to p
    n = 2**np.floor(np.log(p)/np.log(2))

    # Extract the exponent
    n = int(np.log(n)/np.log(2))

    # Build successive box sizes (from 2**n down to 2**1)
    sizes = 2**np.arange(n, 1, -1)

    # Actual box counting with decreasing size
    counts = []
    for size in sizes:
        counts.append(boxcount(Z, size))

    # Fit the successive log(sizes) with log (counts)
    coeffs = np.polyfit(np.log(sizes), np.log(counts), 1)
    return -coeffs[0]

special = [
    'https://upload.wikimedia.org/wikipedia/commons/thumb/7/7c/Peano_Sierpinski_carpet_4.svg/440px-Peano_Sierpinski_carpet_4.svg.png',
    'https://upload.wikimedia.org/wikipedia/commons/thumb/3/3b/Quadratic_Koch_2.svg/2880px-Quadratic_Koch_2.svg.png',
    'https://upload.wikimedia.org/wikipedia/commons/thumb/5/55/Quadratic_Koch.svg/300px-Quadratic_Koch.svg.png'
]
images = [
    'https://upload.wikimedia.org/wikipedia/commons/thumb/7/7c/Peano_Sierpinski_carpet_4.svg/440px-Peano_Sierpinski_carpet_4.svg.png',
    'https://upload.wikimedia.org/wikipedia/commons/thumb/b/b7/Sierpinski_carpet_3.svg/244px-Sierpinski_carpet_3.svg.png',
    'https://upload.wikimedia.org/wikipedia/commons/f/f0/Flocke.PNG',
    'https://upload.wikimedia.org/wikipedia/commons/thumb/3/3b/Quadratic_Koch_2.svg/2880px-Quadratic_Koch_2.svg.png',
    'https://upload.wikimedia.org/wikipedia/commons/thumb/5/55/Quadratic_Koch.svg/300px-Quadratic_Koch.svg.png'
]

dimensions = [(np.log(3)/np.log(2)), (np.log(3)/np.log(2)), (np.log(4)/np.log(3)), 1.46, 1.5]


for dim, im in zip(dimensions, images):
    # load im
    x = plt.imread(im)
    if im in special:
        print("Minkowski–Bouligand dimension (computed): ", fractal_dimension(x[:,:,3]))
        print("theoretical:        ", dim)
        plt.imshow(x[:,:,3])
        plt.show()

    else:
        print("Minkowski–Bouligand dimension (computed): ", fractal_dimension(x[:,:,1]))
        print("theoretical:        ", dim)
        plt.imshow(x[:,:,1])
        plt.show()
and the result:
Minkowski–Bouligand dimension (computed): 1.2520783111100287
theoretical: 1.5849625007211563
Minkowski–Bouligand dimension (computed): 1.5312446549468788
theoretical: 1.5849625007211563
Minkowski–Bouligand dimension (computed): 1.3215737426881282
theoretical: 1.2618595071429148
Minkowski–Bouligand dimension (computed): 1.2853892200376038
theoretical: 1.46
Minkowski–Bouligand dimension (computed): 0.8924059168189398
theoretical: 1.5
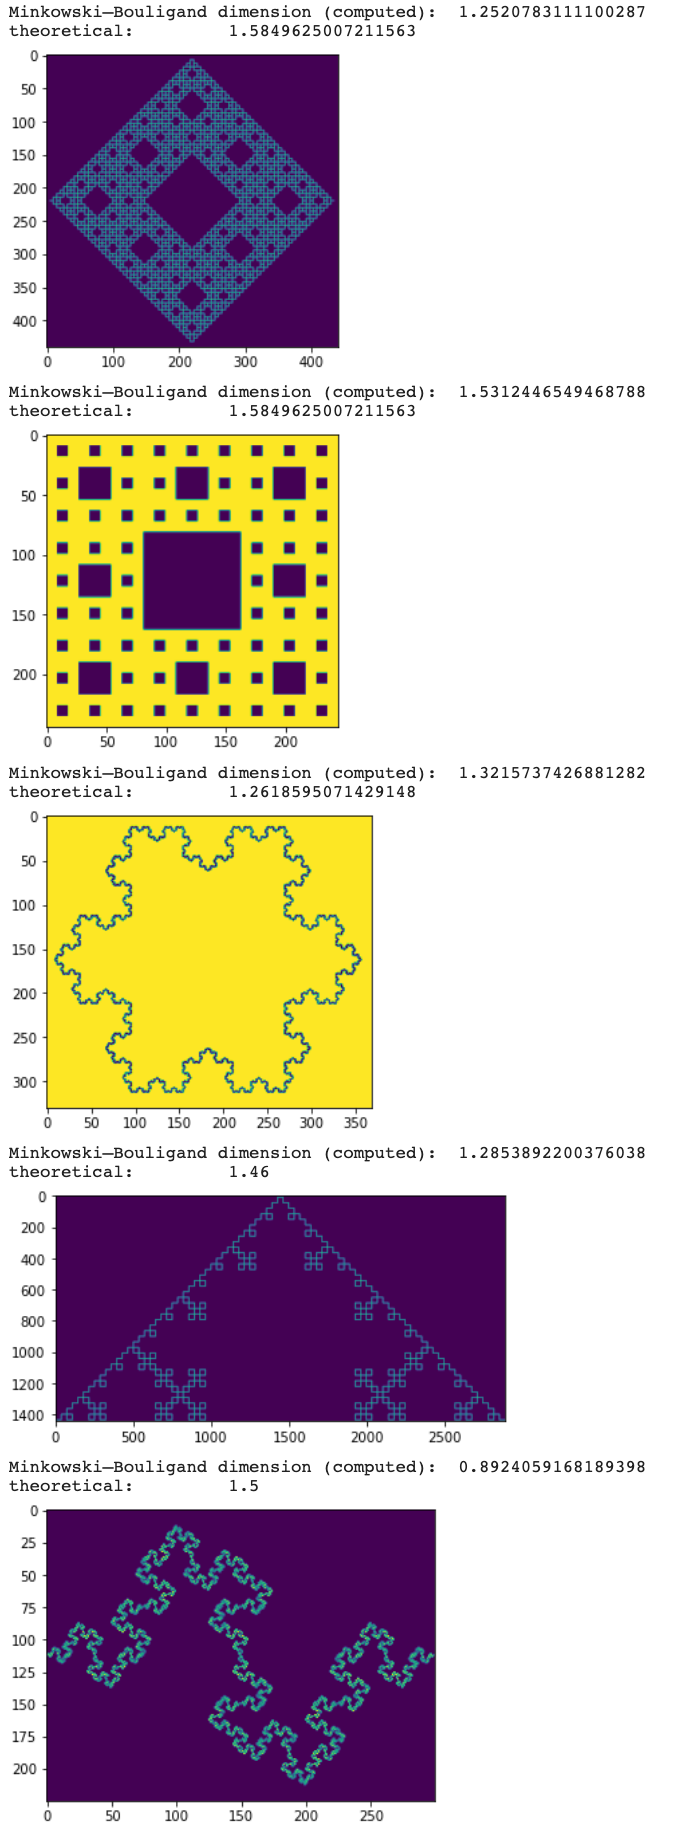
I'm not sure but the images seems to be a bit noisy which might impact the computation. Can you try to make black and white (for example I = I > 0.5 and check if the result is the same? If this is the case, this means we need some threshold value when deciding if a box is empty or not.
Except for the first and last, they are all binary (ie B&W). I have tried and you were right, @rougier, about those, setting the threshold to 0.2 works on them.
What about this note?
Also, I believe that it should go to squares 2x2, that is:
sizes = 2**np.arange(n, 2, -1)should becomesizes = 2**np.arange(n, 0, -1).
I am curious because you used to have it that way (at least that is what I see in the history) but you have a discrepancy in the note and in the code. Your code says:
2**np.arange(n, 1, -1) # eg for n=4 you get array([16, 8, 4])but the comment says
Build successive box sizes (from 2**n down to 2**1) which suggest this code:
2**np.arange(n, 0, -1) # eg for n=4 you get array([16, 8, 4, 2])And that I believe is the correct code.
Code
import numpy as np
import matplotlib.pyplot as plt

def fractal_dimension(Z, threshold=0.9):

    # Only for 2d image
    assert(len(Z.shape) == 2)

    # From https://github.com/rougier/numpy-100 (#87)
    def boxcount(Z, k):
        S = np.add.reduceat(
            np.add.reduceat(Z, np.arange(0, Z.shape[0], k), axis=0),
                               np.arange(0, Z.shape[1], k), axis=1)

        # We count non-empty (0) and non-full boxes (k*k)
        return len(np.where((S > 0) & (S < k*k))[0])


    # Transform Z into a binary array
    Z = (Z < threshold)
    plt.imshow(Z)
    plt.show()

    # Minimal dimension of image
    p = min(Z.shape)

    # Greatest power of 2 less than or equal to p
    n = 2**np.floor(np.log(p)/np.log(2))

    # Extract the exponent
    n = int(np.log(n)/np.log(2))

    # Build successive box sizes (from 2**n down to 2**1)
    sizes = 2**np.arange(n, 1, -1)

    # Actual box counting with decreasing size
    counts = []
    for size in sizes:
        counts.append(boxcount(Z, size))

    # Fit the successive log(sizes) with log (counts)
    coeffs = np.polyfit(np.log(sizes), np.log(counts), 1)
    return -coeffs[0]

special = [
    'https://upload.wikimedia.org/wikipedia/commons/thumb/7/7c/Peano_Sierpinski_carpet_4.svg/440px-Peano_Sierpinski_carpet_4.svg.png',
    'https://upload.wikimedia.org/wikipedia/commons/thumb/3/3b/Quadratic_Koch_2.svg/2880px-Quadratic_Koch_2.svg.png',
    'https://upload.wikimedia.org/wikipedia/commons/thumb/5/55/Quadratic_Koch.svg/300px-Quadratic_Koch.svg.png'
]
images = [
    'https://upload.wikimedia.org/wikipedia/commons/thumb/7/7c/Peano_Sierpinski_carpet_4.svg/440px-Peano_Sierpinski_carpet_4.svg.png',
    'https://upload.wikimedia.org/wikipedia/commons/thumb/b/b7/Sierpinski_carpet_3.svg/244px-Sierpinski_carpet_3.svg.png',
    'https://upload.wikimedia.org/wikipedia/commons/f/f0/Flocke.PNG',
    'https://upload.wikimedia.org/wikipedia/commons/thumb/3/3b/Quadratic_Koch_2.svg/2880px-Quadratic_Koch_2.svg.png',
    'https://upload.wikimedia.org/wikipedia/commons/thumb/5/55/Quadratic_Koch.svg/300px-Quadratic_Koch.svg.png'
]

dimensions = [(np.log(3)/np.log(2)), (np.log(3)/np.log(2)), (np.log(4)/np.log(3)), 1.46, 1.5]


for dim, im in zip(dimensions, images):
    # load im
    x = plt.imread(im)
    if im in special:
        print("Minkowski–Bouligand dimension (computed): ", fractal_dimension(x[:,:,3], threshold=0.2))
        print("theoretical:        ", dim)
        print(f"min {x[:,:,3].min()} and max {x[:,:,3].max()} in the array/image")

    else:
        print("Minkowski–Bouligand dimension (computed): ", fractal_dimension(x[:,:,1],threshold=0.2))
        print("theoretical:        ", dim)
        print(f"min {x[:,:,1].min()} and max {x[:,:,1].max()} in the array/image")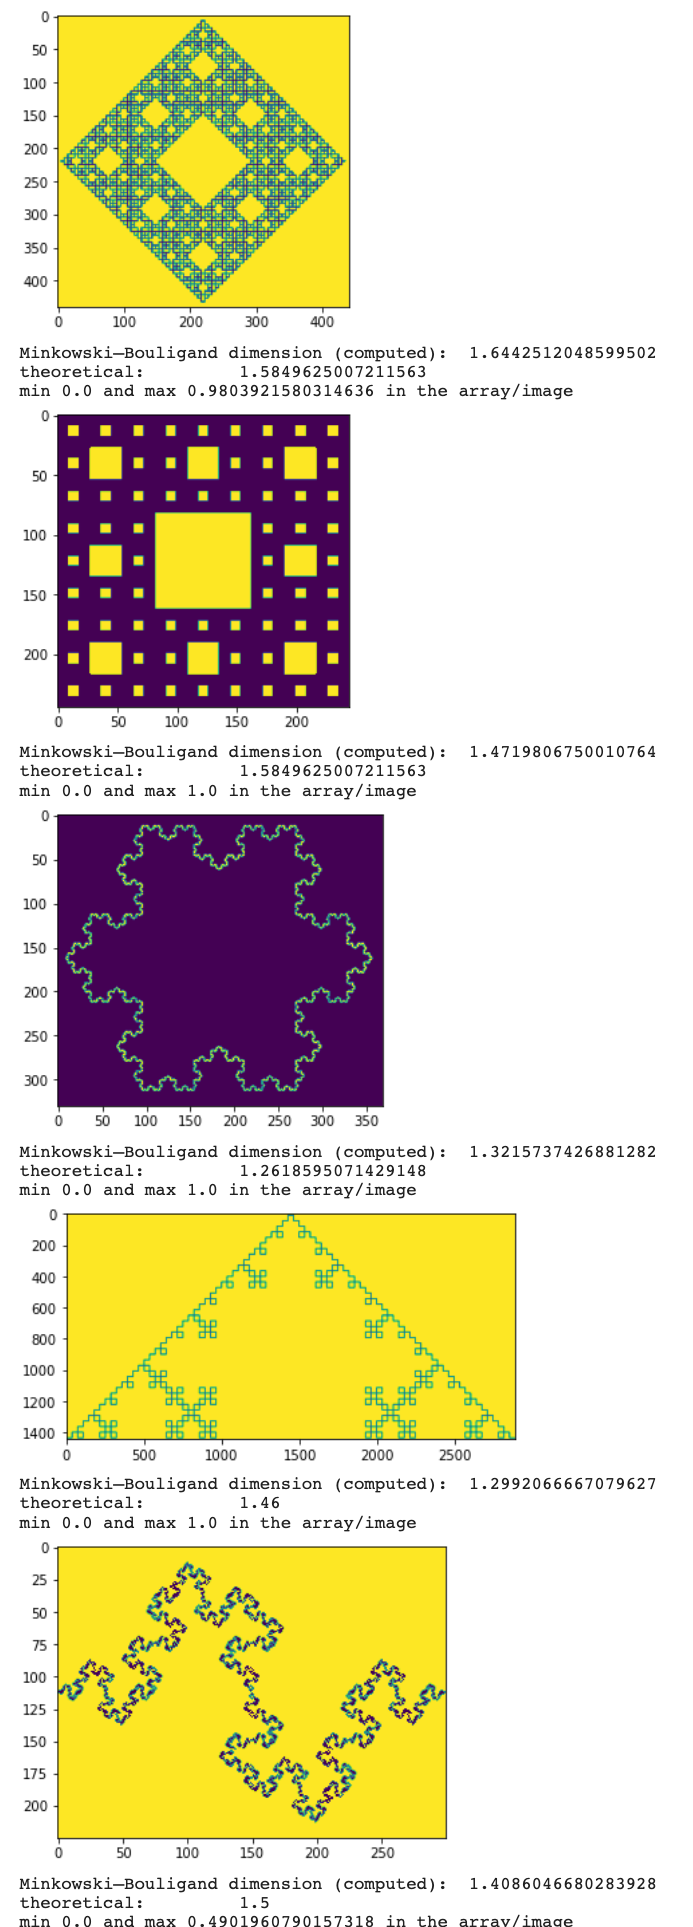
I am getting this error message when executing this programme in PyCharm.
1)"AttributeError: module 'scipy.misc' has no attribute 'imread'"
2) "AttributeError: module 'scipy' has no attribute 'misc'"
@akshahi17 check this answer https://stackoverflow.com/questions/15345790/scipy-misc-module-has-no-attribute-imread
the function has been deprecated so you can either downgrade (not recommended) or use what @rougier recommended (imageio) or what I'm using, imread in matplotlib.pyplot.
Hi! I found this code very useful and I would like to cite it in my paper. Is there a correct way to cite this? Please help! I have to submit soon!
Glad the code is useful but I'm afraid there there's no proper way to cite a it. Maybe as a misc bibitem with the relevant url/author.
hello
sorry, can anyone tell me how to change the data that I want to get from the link to my laptop data?
I want to try to extract features of an iris
thanks, @jankaWIS
and sorry if I ask again is the 52 line is
images = [
'https://upload.wikimedia.org/wikipedia/commons/thumb/7/7c/Peano_Sierpinski_carpet_4.svg/440px-Peano_Sierpinski_carpet_4.svg.png',
'https://upload.wikimedia.org/wikipedia/commons/thumb/b/b7/Sierpinski_carpet_3.svg/244px-Sierpinski_carpet_3.svg.png',
'https://upload.wikimedia.org/wikipedia/commons/f/f0/Flocke.PNG',
'https://upload.wikimedia.org/wikipedia/commons/thumb/3/3b/Quadratic_Koch_2.svg/2880px-Quadratic_Koch_2.svg.png',
'https://upload.wikimedia.org/wikipedia/commons/thumb/5/55/Quadratic_Koch.svg/300px-Quadratic_Koch.svg.png'
]
?
sorry I using the jupyter notebook so not to know about the number
Why are boxes of 2x2 excluded?
Hi, this piece of code is really useful.
Please can you help me out, I am having trouble in figuring out the "boxcount" method written.
My particular confusion lies in the return statement, "return len(np.where((S > 0) & (S < kk))[0])" S>0 implies that there is some value in that pixel, but what about the later part i.e. S<kk[0].
Thank you in advance :)