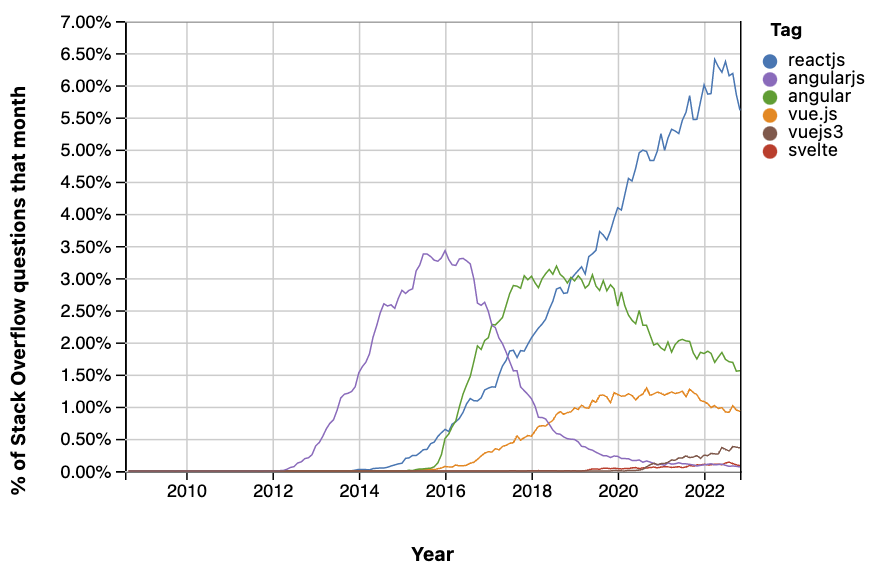
Charts are from different sources and thus colors are inconsistent, please carefully read the chart's legends.
Like this? Check React Native vs Flutter: https://gist.github.com/tkrotoff/93f5278a4e8df7e5f6928eff98684979
| package com.zendesk.zts.search | |
| import com.typesafe.scalalogging.StrictLogging | |
| import monix.execution.Scheduler.Implicits.global | |
| import monix.eval.Task | |
| import monix.execution.atomic.AtomicInt | |
| import scala.concurrent.duration._ | |
| import scala.concurrent.Future |
| #### | |
| # ZSH function to auto-switch to correct Node version | |
| # https://gist.github.com/callumlocke/30990e247e52ab6ac1aa98e5f0e5bbf5 | |
| # | |
| # - Searches up your directory tree for the closest .nvmrc, just like `nvm use` does. | |
| # | |
| # - If you are already on the right Node version, IT DOES NOTHING, AND PRINTS NOTHING. | |
| # | |
| # - Works correctly if your .nvmrc file contains something relaxed/generic, | |
| # like "4" or "v12.0" or "stable". |
| let NETWORK_PRESETS = { | |
| 'GPRS': { | |
| 'offline': false, | |
| 'downloadThroughput': 50 * 1024 / 8, | |
| 'uploadThroughput': 20 * 1024 / 8, | |
| 'latency': 500 | |
| }, | |
| 'Regular2G': { | |
| 'offline': false, | |
| 'downloadThroughput': 250 * 1024 / 8, |
Charts are from different sources and thus colors are inconsistent, please carefully read the chart's legends.
Like this? Check React Native vs Flutter: https://gist.github.com/tkrotoff/93f5278a4e8df7e5f6928eff98684979
This is a compiled list of falsehoods programmers tend to believe about working with time.
Don't re-invent a date time library yourself. If you think you understand everything about time, you're probably doing it wrong.
| #!/bin/bash | |
| # To run this script you need to give execute permission. | |
| # $chmod +x restart_bluetooth.sh; | |
| # If you want only to restart: | |
| # $ ./restart_bluetooth.sh; | |
| # If you want to turn bluetooth on; | |
| # $ ./restart_bluetooth.sh 1; | |
| # If you want to turn bluetooth off; | |
| # $ ./restart_bluetooth.sh 0; |
| /** | |
| * Register a debug helper for Handlebars to be able to log data or inspect data in the browser console | |
| * | |
| * Usage: | |
| * {{debug someObj.data}} => logs someObj.data to the console | |
| * {{debug someObj.data true}} => logs someObj.data to the console and stops at a debugger point | |
| * | |
| * https://gist.github.com/elgervb/5c38c8d70870f92ef6338a291edf88e9 | |
| * | |
| * @param {any} the data to log to console |
| /* | |
| ##Device = Desktops | |
| ##Screen = 1281px to higher resolution desktops | |
| */ | |
| @media (min-width: 1281px) { | |
| /* CSS */ | |
All of the below properties or methods, when requested/called in JavaScript, will trigger the browser to synchronously calculate the style and layout*. This is also called reflow or layout thrashing, and is common performance bottleneck.
Generally, all APIs that synchronously provide layout metrics will trigger forced reflow / layout. Read on for additional cases and details.
elem.offsetLeft, elem.offsetTop, elem.offsetWidth, elem.offsetHeight, elem.offsetParent